The spatial integration of immigrants in Europe

Working on 1,396 sub-regional areal units, Daniel T. Lichter, Domenico Parisi, and Shrinidhi Ambinakudige show that in almost all European countries, immigrants from outside Europe are less spatially integrated with the native population
than are immigrants from other countries within Europe. Differences in immigrant-native spatial integration are reflected in the large numbers of immigrant regional “hot spots” which are driven by public policy and idiosyncratic political considerations at the national and regional or sub-regional levels.
Introduction
Throughout much of Europe, new waves of immigration have raised concerns about cultural fragmentation and disunity, interethnic conflict, and growing antipathy toward immigrants. Our goal is to provide up-to-date comparative evidence of uneven patterns of population concentration, at multiple geographical levels, among immigrants and natives, both within and between European countries. Previous studies have mostly centered on neighborhood-to-neighborhood differences in immigrant residence patterns within a single city. Other studies have compared neighborhood segregation between several cities within a single country, or examined a small number of cities in countries sharing common cultural or economic characteristics (Musterd 2005; Massey 2016).
We focus instead on patterns of macro-segregation within countries, using the 1396 sub-regional or county units, as defined by the Nomenclature of Territorial Units for Statistics (NUTS 3; Eurostat 2018b).
Macro-segregation: within and between countries
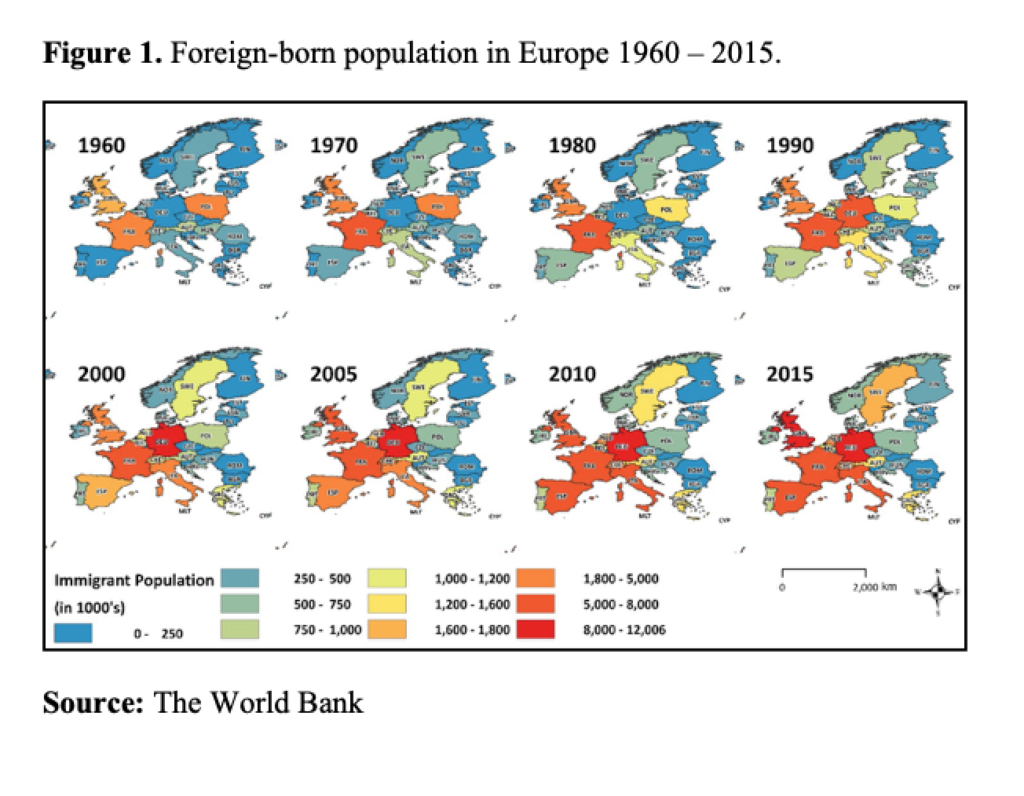
In Europe, macro-segregation is revealed, first and foremost, in large country-to-country differences in the presence of immigrant (i.e. foreign-born) populations, and in their evolution over time (Figure 1).

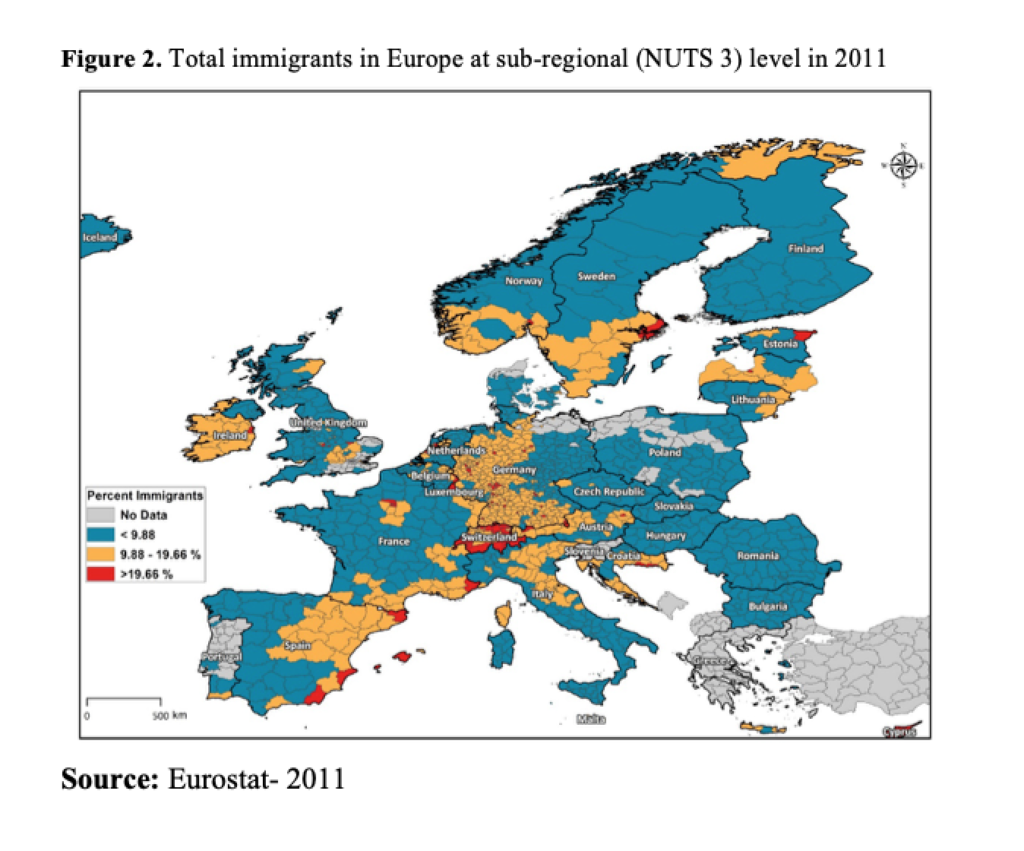
However, variation across countries conceals substantial spatial variation within countries. Figure 2 displays the sub-regional areal unit (NUTS 3 level) map, by classes of relative foreign presence:
- less than the overall European average of 9.88 percent,
- more than 9.88 percent but less than twice the European average (9.88 to 19.66 percent), and
- more than twice the average (19.66 percent or more).

Large parts of Eastern Europe (Poland, Slovakia, Hungary, and Romania) are overwhelmingly native-born, as is the case in much of Finland and outlying rural areas in Sweden, Norway, and France. But even in low-immigration countries there are clear regional “hotspots” of immigrant population concentration. In Finland, immigrants are concentrated along the southern (e.g., in the Helsinki metro area) and western coasts (near Vaasa), and in Hungary, in the Budapest region (which does not show in the data, because percentages are below the overall European average in all cases).
In Italy, France, and the United Kingdom, the spatial distribution of immigrants is more highly concentrated (e.g., in the London area in the U.K.; Northern Italy; and Paris, Lyon, and Marseille in France). Immigrants are distributed in high percentages across much of the western part of Germany, with immigrant “hotspots” similarly distributed broadly across this region of the country. The former East Germany, on the other hand, is mostly comprised of native-born German populations and has experienced substantial net outmigration to Berlin and regions of former West Germany with stronger economic growth and more job opportunities, and where native populations are much less virulently anti-immigrant in sentiment.
Non-European immigrants
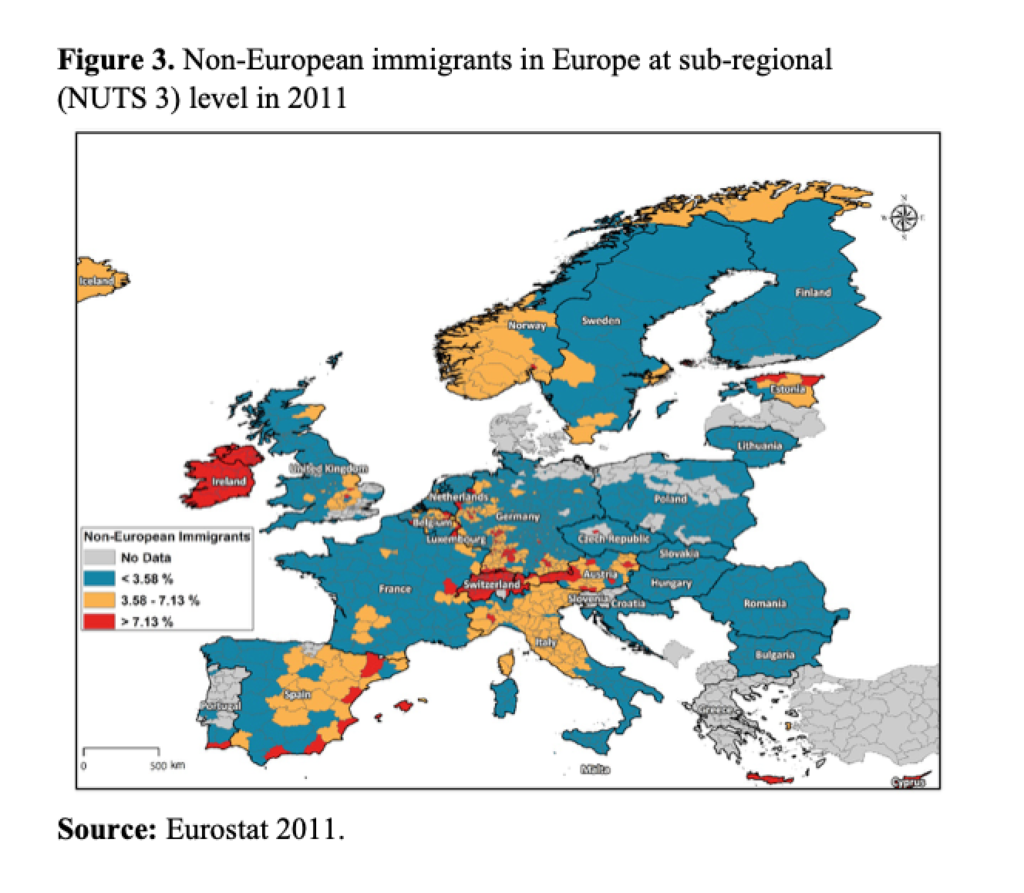
Immigrant population concentration is more uneven when we consider regional “hotspots” of non-European immigrants. Despite the nationalistic anti-immigrant fervor observed across parts of the EU, immigrants from outside Europe actually represent just 3.58 percent, on average, of the total population across sub-regions. Figure 3 reveals the uneven spatial distribution of non-European immigrants at levels below, above, and well above this figure. Non-European immigrants (from Asia and parts of Africa, especially Nigeria) are concentrated in parts of Northern Ireland and Switzerland (and surrounding areas in Germany, France, and Austria). Comparatively large shares of non-European immigrants (most often originating from the former Soviet Union) are also present in Estonia and in other densely populated parts of Europe (e.g., Brussels in Belgium, Barcelona and Madrid in Spain). In Germany, above-average percentages of immigrants from Turkey, Greece, and Russia and other groups (Asians) are found in North Rhine-Westphalia (e.g., Cologne), Baden-Württemberg, and Bavaria (e.g., Munich).

A segregation index
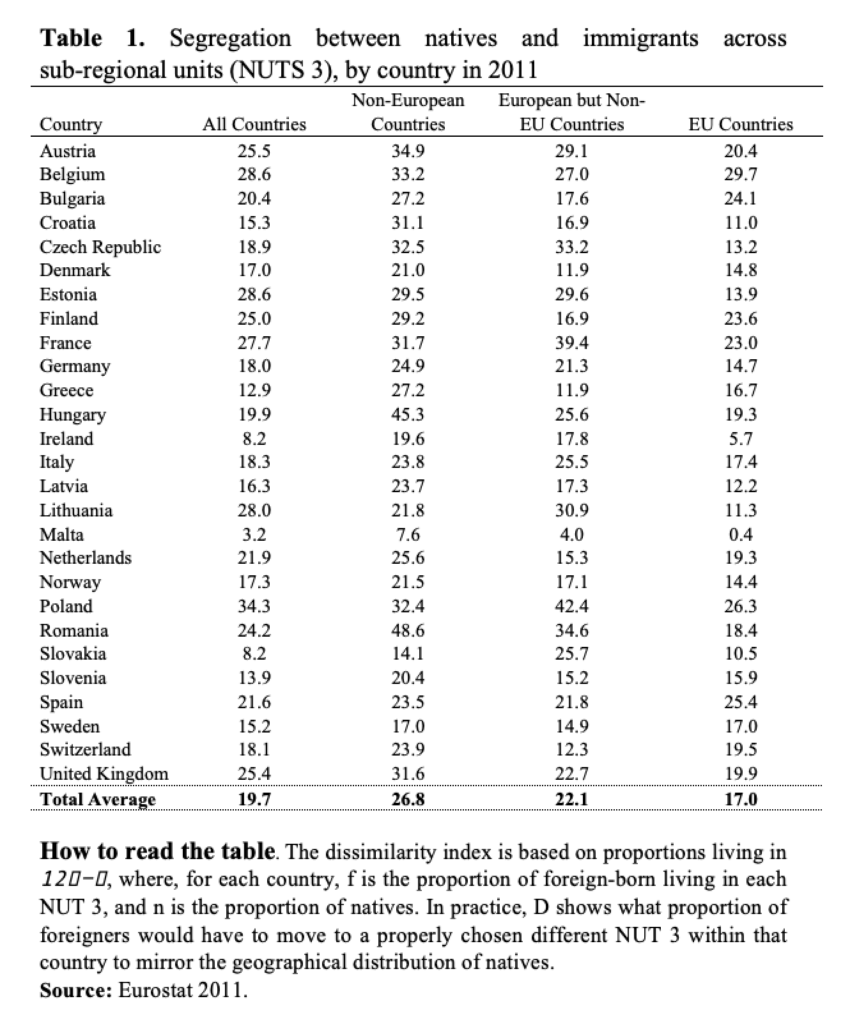
To examine macro-segregation, Table 1 provides immigrant-native segregation indices (D’s) that summarize the uneven within-country spatial distribution of immigrants across European countries. Here, segregation is defined by the uneven distribution of immigrants and natives across NUTS 3 units (i.e., sub-regions or counties). The overall mean D is 19.7 for all 27 European sub-regional areal units, which means that, on average, nearly one in five immigrants (or natives) would have to move to another sub-regional areal unit (another NUT 3 unit) within their country of residence to achieve residential parity with the native-born population.

These estimates of immigrant-native macro-segregation vary substantially across European countries. At the low end, D’s in Malta (3.2), Slovakia (8.2) and Ireland (8.2) suggest that natives and immigrants are spatially integrated at the macro scale. High levels of county-to-county segregation (i.e., macro-segregation) are plainly evident in Poland (34.3), Belgium (28.6), Estonia (28.6), and Lithuania (28.0). These figures also imply that these countries are home to clearly identifiable regional immigrant “hotspots”.
Much of the new immigration in Europe involves the movement of Europeans who share common economic or cultural advantages (e.g., high education) that make segregation less pronounced. Indeed, a large but minority share of the 38.7 million foreign-born residents in the EU-28 or one of the four European Free Trade Association (EFTA) countries (i.e., Iceland, Liechtenstein, Norway, and Switzerland) originated from another EU/EFTA country (16.9 million). The clear implication is that immigrants from another European country are much more likely than non-European immigrants to avoid racialization (e.g., Icelanders in the UK), which can be a serious barrier to integration for immigrants from Africa, the Middle East, or Asia. These data also suggest that simple summary estimates of overall immigrant-native segregation may conceal substantial variation in segregation among non-Western immigrants across Europe.
Columns 2-4 in Table 1 provide immigrant-native segregation scores for immigrants from non-European countries, from European countries, and from European Union member states. In every country except Spain and Sweden, segregation rates are higher among immigrants from non-European countries (26.8) than among those from European Union member countries (17). Segregation from natives occupies an intermediate position among immigrants of non-EU European origin. For immigrants from outside Europe, D’s ranged from a low of 7.6 in Malta to highs of 48.6 in Romania and 45.3 in Hungary, largely reflecting the concentration of immigrants in (a few) large cities.
Discussion and conclusion
Our empirical goal was to provide cross-country multiscale indicators of integration or segregation that answer the question of whether immigrant minority populations share the same social and geographic space as the native-born or majority populations in Europe.
Our results on macro-segregation suggest at least three general conclusions. First, immigrant-native segregation patterns vary widely between and within European countries with very different economies, demographic conditions, and histories of immigration. Additional analyses of country-specific policy have underscored the difficulty in fully accounting for cross-sectional patterns of national and regional segregation among immigrants (Lichter, Parisi, and Ambinakudige 2020).
Second, in almost all European countries, immigrants from outside Europe or the EU are more segregated from natives than are immigrants from other countries in Europe.
Third, and finally, our analyses reinforce recent calls to consider residential integration at alternative levels of geography—from the micro to macro scale (Andersen et al. 2018; Lichter, Parisi, and Taquino 2016).
Our results speak directly to the growing body of research on the emergence and geographic spread of new immigrant destinations or gateways. Immigrants from around the world are dispersing across Europe, but they also are concentrating unevenly at national, regional, and sub-regional levels.
References
Andersson, E. K., Malmberg, B., Costa, R., Sleutjes, B., Stonawski, M. J., & de Valk, H. A. (2018). A comparative study of segregation patterns in Belgium, Denmark, the Netherlands and Sweden: Neighbourhood concentration and representation of non-European migrants. European Journal of Population, 34(2), 251-275.
Eurostat. (2011). Accessed on April 25, 2019.
Eurostat. (2018a). Accessed on April 5, 2019.
Eurostat. (2018b). Regions in the European Union: Nomenclature of territorial units for statistics – NUTS 2016/EU-28. 2018 Edition. Luxembourg: Publications Office of the European Union.
Lichter, D. T., Parisi, D., & Taquino, M. C. (2015). Toward a new macro-segregation? Decomposing segregation within and between metropolitan cities and suburbs. American Sociological Review, 80(4), 843-873.
Lichter, D.T., Parisi, D., & Ambinakudige, S. (2020). The spatial integration of immigrants in Europe: A cross‑national study. Population Research and Policy Review, 39(3), 465–491.
MIPEX 15. (2017). Retrieved from mipex.eu on October 5, 2017.
Massey, D. S. (2016). Segregation and the perpetuation of disadvantage. The Oxford Handbook of the social science of poverty, 16, 369-405
Musterd, S. (2005). Social and ethnic segregation in Europe: Levels, causes, and effects. Journal of urban affairs, 27(3), 331-348.
Teitelbaum, M. S. (2015). Political demography: Powerful trends under-attended by demographic science. Population studies, 69(sup1), S87-S95.