The significance of age to the study of ethnic residential segregation

In the study of ethnic residential segregation, global measures are typically used. However, while useful as summary indicators, these measures miss important and distinctive age-specific and birth-cohort trends. Albert Sabater and Gemma Catney demonstrate this for England and Wales (2001 and 2011).
Are there distinctive patterns of ethnic residential segregation across the life course?
In a recent publication (Sabater and Catney 2018), we examine variations in ethnic residential segregation across the life course, represented in our study by particular age groups and ‘stages’ of life. We argue that taking such an approach is important in contexts with simultaneous growth of young and ageing minority ethnic populations for understanding the local dynamics of ethnic geographies.
Using harmonised small area data (8,546 wards) for England and Wales (2001-2011), we demonstrate the usefulness of our approach by applying two measures of segregation: the dissimilarity index (ID) and the isolation index (P*). These two commonly-employed measures capture two key dimensions of residential segregation (evenness and exposure), and allow straightforward comparisons of global, age group and birth-cohort segregation both nationally and internationally. In the study, we analyse the evolution of ethnic residential geographies for the eight largest and most stable categories from 2001 to 2011: White British, Other White, Indian, Pakistani, Bangladeshi, Black Caribbean, Black African and Chinese. Ethnicity data used in UK national statistics relies on individuals’ self-definition.
The computation of ethnic residential segregation with an age dimension is equivalent to the summary or ‘global’ calculation for all groups, although the analysis relies on an index value for each age group. The use of age for the analysis of ethnic residential segregation increases our knowledge about the spatial incorporation of each group because it highlights two important characteristics about an individual: their place in the life cycle – whether a young adult, middle-aged or older – and their membership in a cohort of individuals who were born at a similar time. Further, since the characteristics of younger or older adults may differ at a given period, the use of birth-cohorts provides one way to examine the trajectory of residential segregation of ethnic groups as they pass through life course phases, including when household sizes may be growing or reducing.
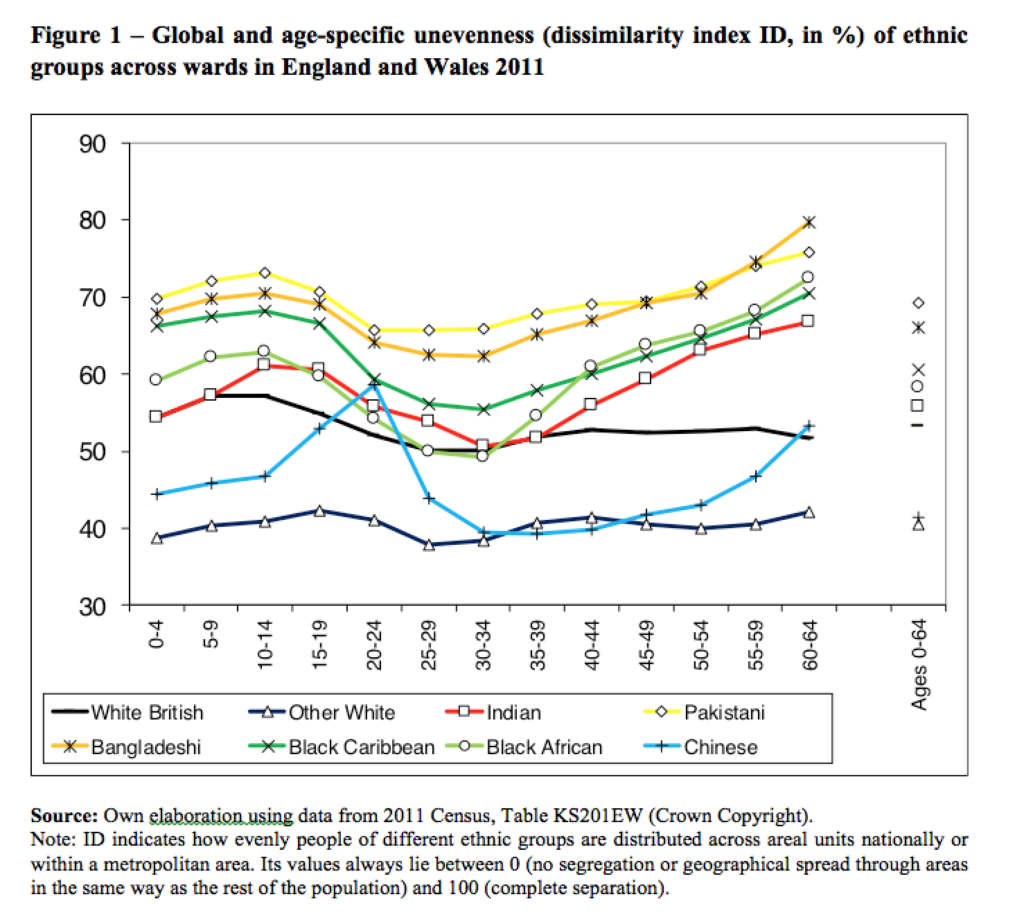
Results on age-specific ethnic segregation clearly demonstrate that this simple demographic approach to analysing segregation by age groups can provide an important contribution to the ethnic segregation debate. Most studies using global measures depict segregation as either low, moderate or high, yet this analysis reveals significant differences in segregation by age between ethnic groups. For instance, the oldest age group (60-64) in this study is the most residentially segregated group in 2011 (measured here by the dissimilarity index), particularly for the Bangladeshi (79.8%), Pakistani (75.8%), Black African (72.5%), Black Caribbean (70.5%) and Indian (66.7%) groups, whose overall segregation can be considered as high (figure 1).

Perhaps more importantly, the results from figure 1 also highlight variations in segregation across the life course, represented here by particular age groups and ‘stages’ of life. Three distinctive phases can be identified, with higher levels of segregation at the youngest and oldest age categories (those within the 0-19 and 45-64 ranges), and lower levels of segregation for the ‘middle’ age categories (within the 20-44 ranges). It can be seen that the youngest group is more residentially segregated compared to the ‘middle’ age group. This is the result of clustering with their immediate family members in the same household, a situation which, in turn, is determined by the forces of choice and constraint on parents/families. Of course, while most children in the youngest group are likely to live in the same household with their parents, not all individuals in the ‘middle’ age categories are parents, thus the differences that we observe between these two age categories can be interpreted in terms of the impact of household composition and family location on residential segregation. Crucially, these phases are to a large extent common to all ethnic groups, and the consistency in relative levels of segregation found for the global values are generally observable across all age categories. The only departure from the common trends is the distinctive segregation patterning of the Chinese ethnic group aged 20-24, whose segregation (58.6%) is associated with overseas migration to UK universities as well as post-student retention, particularly in urban centres across England and Wales.
Cohort/generational change in terms of spatial mixing
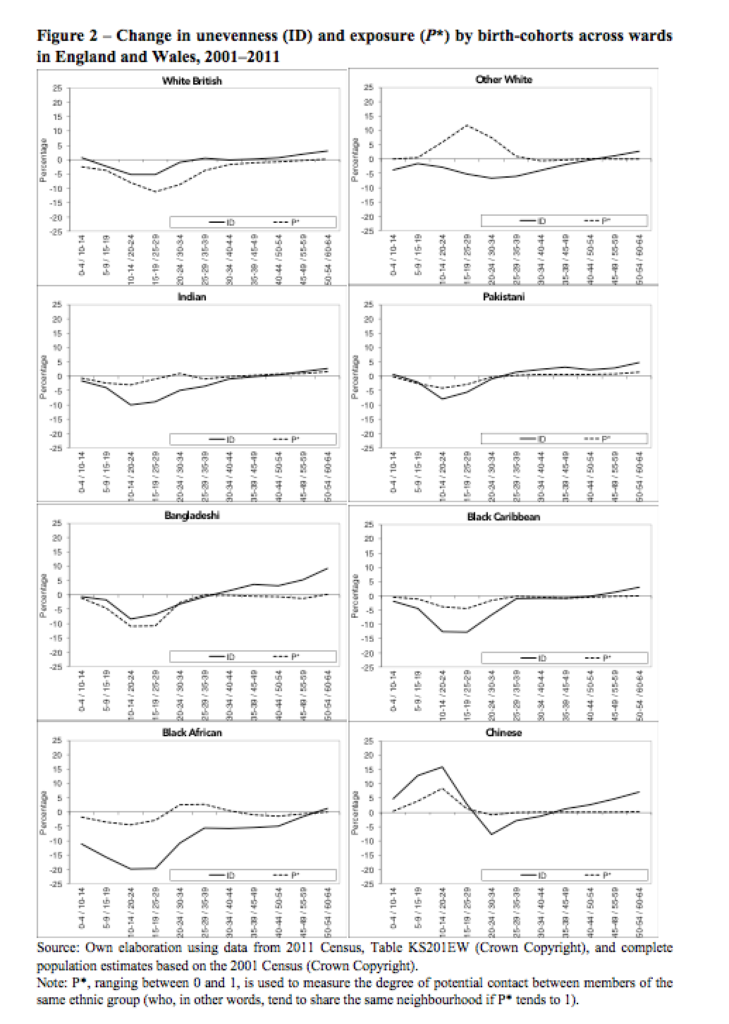
Another part of our study is to examine how the residential segregation of ethnic groups evolves with age. This is an important aspect because it allows us to see whether or not there are cohort/generational changes in terms of spatial mixing for all ethnic groups. Figure 2 shows change in segregation across all wards in England and Wales since 2001, in terms of unevenness (ID) and exposure (P*) of ethnic groups by cohorts.
The analysis of ID across birth-cohorts indicates similar changes in geographical spread during the decade for all ethnic groups. First, the youngest cohort, which refers to children living with their parents, and older cohorts in their 40s, 50s and 60s, have experienced marginal changes in unevenness. Meanwhile, a clear decrease in unevenness is observed among cohorts in their 20s and 30s in 2011. For instance, ID values show a substantial percentage point decrease for birth-cohorts 10-14 in 2001 and 20-24 in 2011, particularly among Black African (-19.9), Black Caribbean (-12.6), Indian (-10.1), Bangladeshi (-8.5) and Pakistani (-7.9) groups.

The examination of ID values by cohorts shows a changing experience of ethnic segregation as people age. In a similar fashion to analyses of residential mobility by age, our results demonstrate that residential segregation decreases during young adulthood for all cohorts, then increases during the late 20s and early 30s, and continues to increase across mid-life until retirement. For instance, greater residential segregation in terms of unevenness can be seen for the White British groups who at the start of the 2001-2011 period, were aged 35-39 (+0.2), 40-44 (+0.6), 45-49 (+1.9) and 50-54 (+3.1). Similarly, a pattern of increased segregation is identifiable among the oldest cohorts (i.e. aged 50-54 in 2001) of most minority ethnic groups. Nonetheless, the results also indicate a lower geographical spread during the decade at somewhat younger ages for some minority ethnic groups – for instance, among Pakistani and Bangladeshi in their late 20s and early 30s – ranging from +1.4 (Pakistani aged 25-29 and Bangladeshi aged 30-34 in 2001) to +3.6 (Pakistani and Bangladeshi aged 35-39 in 2001).
Given that one of the most important attributes of birth-cohorts is the number of people born into the group, the number of arrivals from abroad, and the mortality of that group, the index of isolation (P*) is also employed here to highlight birth-cohort differences in population composition between ethnic groups. While the results indicate that the larger volume of births, particularly among some groups such as the Bangladeshi and Pakistani group, and streams of (family) immigration combine to produce marginal changes in residential segregation for birth-cohorts in their late 20s and early 30s, the most remarkable change in P* over the decade is a decrease for most birth-cohorts in their teens and 20s. The latter reflects widespread decreases in the average local population of ethnic minorities due to out-migration from ethnic concentration areas, associated with migration from cities, particularly for those at the family-building life stage (Sabater and Finney, 2014).
Meanwhile, older birth-cohorts of all ethnic groups experience greater neighbourhood segregation. This is because many older people, especially those entering pre-retirement ages, have largely settled in their neighbourhoods and aged in place. While for many older cohorts neighbourhood attachment and belonging may have contributed to these settlement patterns of ethnic concentration, for others it may reflect the outcome of cumulative disadvantages, particularly with regard to the housing market. Although the gradual, if slow, dispersal of all ethnic groups has contributed to desegregation over time, it is important to highlight that exclusionary forces such as racial stereotyping and discrimination have also played a crucial role in reinforcing minority ethnic concentration among older cohorts.
Implications
Most work on ethnic residential segregation fails to consider that the residential patterning of ethnic minorities for any place becomes more complex if age structures of recent immigrants are juxtaposed with those of second- and third-generation minority groups. A useful way to overcome this problem is to establish whether ethnic residential segregation at different times and contexts varies by age groups (i.e. between people who were born at different periods) and birth-cohorts (i.e. between people who were born in the same period), and whether there are differences or similarities between ethnic groups at key stages of the life course.
References
A. Sabater & G. Catney, (2018). Unpacking Summary Measures of Ethnic Residential Segregation Using an Age Group and Age Cohort Perspective. European Journal of Population, vol. First Online, pp. 1-29. DOI: 10.1007/s10680-018-9475-3 [Open Access]
A. Sabater & N. Finney (2014). Demographic Understandings of Changes in Ethnic Residential Segregation Across the Life Course. In C. Lloyd , I. Shuttleworth and D. Wong, (eds), Social segregation: concepts, processes and outcomes. Bristol: Policy Press, 269-300.