Internal migration and spatial de-concentration of population in Latin America

Little is known about the details of migration across the urban hierarchy in Latin America and the Caribbean (LAC). Building on their recent work, Jorge Rodriguez Vignoli and Francisco Rowe examine how internal migration is reshaping the urbanization process
and population distribution across the human settlement system of 10 LAC countries
Urbanization has evolved very rapidly in Latin America and the Caribbean (LAC) in the past 50 years or so, with the share of urban population increasing from 50% in 1961 to 80% in 2015. A similar change took more than 100 years in North America. LAC is now one of the world’s most urbanized regions. By comparison, in 2015, the share of urban population was 73% in Europe, 48% in Africa and only 40% in Asia (UN, 2015).
The rapid urbanization process in LAC was largely spurred by an economic model based on an import-substitution strategy, which encouraged firms and people to move into metropolitan areas with large consumer markets, especially during the 1930s and the 1970s (ECLAC, 2012; Rowe, 2013; Villa and Alberts, 1980). During the 1980s, instead, the economic strategy in most of LAC shifted to the adoption of a market-oriented development policy, promoting export-led economic growth based on natural resources. This shift usually leads to a deceleration of the urbanization process and a diversification of internal migration flows, favoring rural areas and cities linked to commodities production, but we lack direct data on this period. For more recent periods, however, a new source of information exists and can be usefully exploited.
Data and definitions
We built five-year transition migration matrices from the 2000 and 2010 census rounds.¹ City boundaries were obtained from the “Spatial Distribution of Population and Urbanisation in Latin America” database, hosted by CELADE and census microdata were processed via REDATAM.² Together these data provide coverage for eight LAC countries from the 2000 census round and 10 countries from the 2010 census round,³ and are based on temporally consistent urban boundaries. The boundaries correspond to 2010 census round geographies and thus account for recent urban population growth.
Most of the countries considered here do not refer to “cities” when they classify their territory: most often, they rely on administrative areas (i.e. municipalities or counties). Therefore, we had to reconstruct the overall picture in a homogeneous and internationally comparable way, and we encountered three main situations:
a) several administrative units forming in reality one large city: in this case we merged them;
b) one administrative unit including a city: we kept the administrative unit;
c) one administrative unit not including a city: we considered it as a rural area.
With these definitions, we obtained national migration matrices capturing moves between cities of various sizes, as well as moves between cities and our category “rural area”. To simplify the picture, we created six types of areas, depending on their size:
– metropolitan areas (1 million population or more),
– large cities (500,000-999,999),
– standard cities (100,000-499,999),
– intermediate cities (50,000-99,999),
– small cities (20,000-49,999) and
– rural areas (19,999 or less).[4]
and we considered matrices of moves between these six areas.
Based on these matrices, we analysed changes in the contemporary patterns of internal migration across the urban hierarchy over the last decade, and identified how these movements have reshaped urbanisation and the highly concentrated population structure of the Latin American human settlement system.
Net gains and losses across the urban hierarchy
The total number of internal migrants between areas across the urban hierarchy was estimated to be 16.6 million in 2005-2010, most of them city to city.
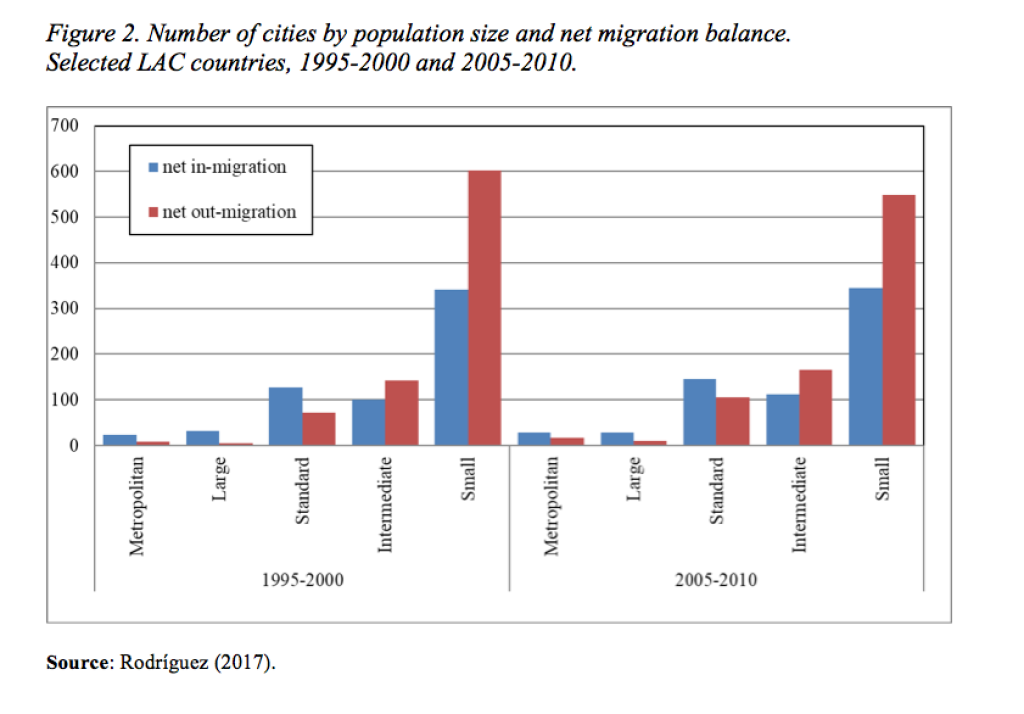
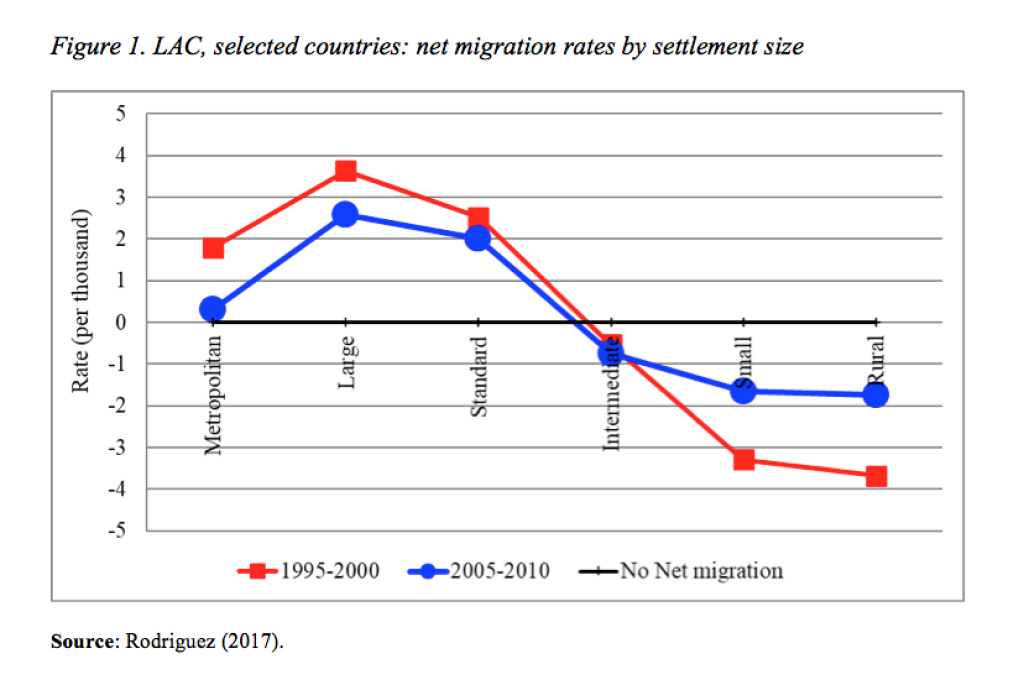
The number of metropolitan areas experiencing net migration losses increased from eight in 1995-2000 to 17 in 2005-10, but remained below the number with net migration gains (24 in 1995-2000 and 28 in 2005-2010): the net migration rate of metropolitan areas, therefore, is still positive, although very low (0.3 per thousand in 2005-2010) (Figures 1 and 2).

Net migration gains were concentrated in large and “standard” cities, both of which, however, proved less attractive in the period. At the opposite end of the dimensional spectrum, intermediate and small cities, as well rural areas, experienced net migration losses over the entire period, even if these proved smaller in 2005-2010 than they had been ten years before, in 1995-2000.
Complementing these findings, in previous research we also showed that internal migration in LAC countries contributes to boosting the demographic dividend in metropolitan, large and “standard” cities by reducing dependency ratios (Rodriguez and Rowe, 2018) and increasing the share of children (i.e. aged 5-14) and older people aged 60 and over in small cities and rural areas (Rodriguez, 2017).
Discussion
The continuing net migration loss of small cities and rural areas seem to respond to the persistent gap in living conditions and employment opportunities between them and large urban centres. Recent evidence points to a widening in this gap as a result of poverty eradication policies and social investments in large and intermediate cities (Rodríguez 2017). The main message of the 2030 Agenda for Sustainable Development, “Leaving no one behind”, will be a major challenge for Latin America and the Caribbean, where the geographic distribution of opportunities is still very unbalanced across the human settlement system.
The increasing number of metropolitan areas experiencing net migration losses is a reflection of major problems, like high crime rates, persistent housing shortages (UN-Habitat 2012; ECLAC, 2012), and insufficient planning and infrastructure. Metropolitan urban sprawl raised local demand for housing and transport infrastructure, resulting in environmental degradation and longer commuting times. Poor governance and limited financial resources are often cited as key hindrances to the development of appropriate policy responses to address these problems (UNFPA 2007; UN-Habitat 2012). Despite these problems, however, metropolitan areas continue to concentrate resources and opportunities (e.g., economic and technological activities, and tertiary educational opportunities), and therefore attract young adults (Rodriguez, 2017).
In between these extremes, large and “standard” cities offer some advantages in terms of quality of life and governance, and they are improving in key spheres such as employment and educational opportunities (ECLAC, 2012). However they still trail metropolitan areas in crucial dimensions like wages, university education, high level jobs, technological infrastructure and cultural activities. And this is why their potential as engines of urban deconcentration has yet to be realized.
References
ECLAC (2012) Economic Commission for Latin America and the Caribbean Population, Territory and Sustainable Development (LC/L.3474(CEP.2/3), Santiago, Chile.
Fujita, M., Krugman P., Venables, A. (2000) The spatial economy: Cities, regions, and international trade. Cambridge, Ma: The MIT Press.
Rodríguez, J. (2017) Cities and migration in Latin America and the Caribbean: updated estimates of key socio-demographic effects.
Rodriguez, J., Rowe F. (2018) How is internal migration reshaping metropolitan populations in Latin America? A new method and new evidence, Population Studies (forthcoming).
Rowe, F. (2013). Spatial Labour mobility in a transition economy: Migration and commuting in Chile, (Ph.D. thesis), The University of Queensland, Brisbane, Australia.
Villa, M., Alberts J. (1980) Redistribución espacial de la población en América Latina, Serie E, Nº 28, Centro Latinoamericano de Demografía (CELADE), Santiago de Chile.
UNFPA (2007) Unleashing the Potential of Urban Growth, New York.
UN (2015) United Nations, World Urbanization Prospects: The 2014 Revision, Department of Economic and Social Affairs, Population Division, New York, (ST/ESA/SER.A/366).
UN-HABITAT (2012) United Nations Human Settlement Programme. State of Latin American and Caribbean cities 2012. Towards a new urban transition. Nairobi, Kenia.
Footnote
¹ Migration matrices are available in MIALC database (www.cepal.org/celade/migracion). The periods covered are (approximately) between 1995 and 2000 (first quinquennium) and between 2005 and 2010 (second quinquennium).
³Bolivia (2012), Brazil (2000, 2010), Costa Rica (2000, 2011), Dominican Republic (2002, 2010) Ecuador (2001, 2010), Honduras (2001, 2013), Mexico (2000, 2010), Panama (2000, 2010), Uruguay (2011), Venezuela (2001, 2011).
[4] Intrametropolitan, intra-city, and rural-to-rural moves are excluded from our matrices.
