New data on life expectancy and standard of living in France

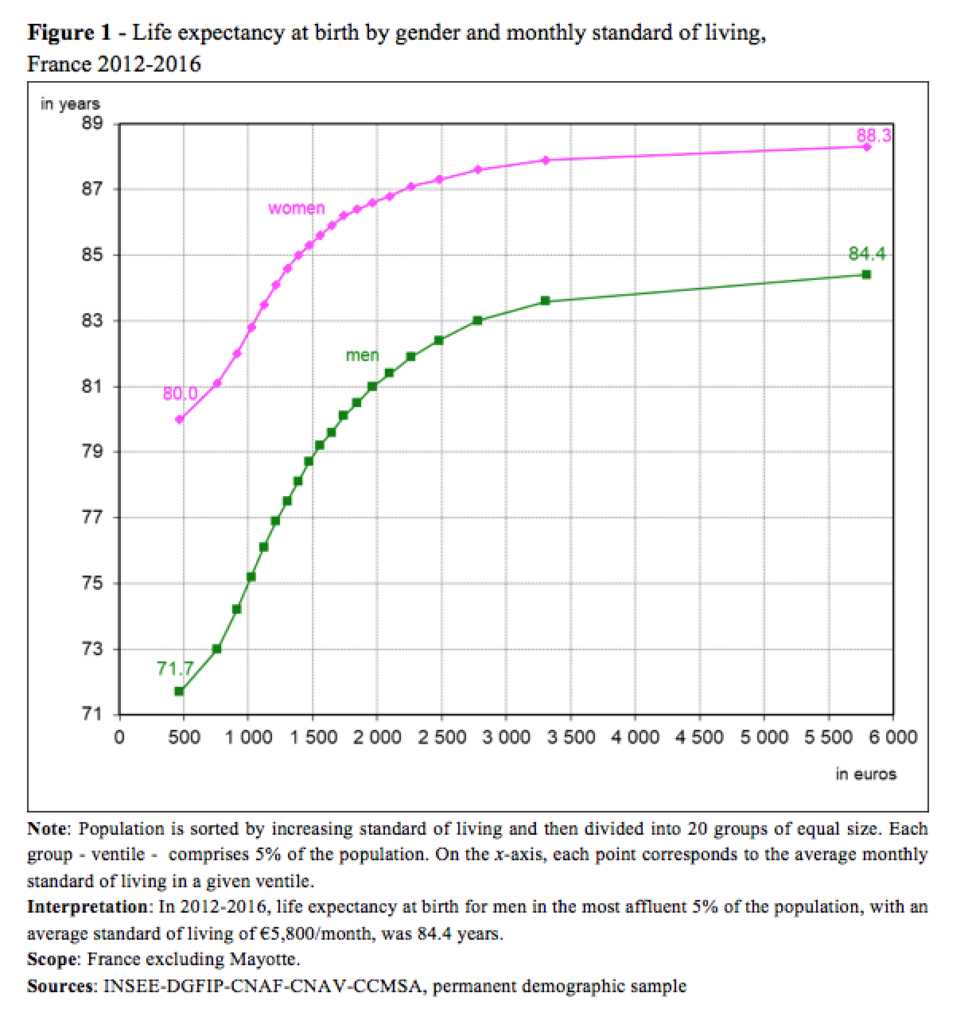
Surprising as it may seem, even in developed countries, systematic and large differences in survival exist between rich and poor populations. In France, for instance, Nathalie Blanpain tells us that life expectancy at birth for men in the most affluent 5% of the population is 84.4 years, compared to 71.7 years in the poorest 5% (a 13-year difference). For women, the gap is smaller: eight years between the most affluent and the poorest.
It is widely known that life expectancy varies according to social class and education (Sasson, Blanpain). However, very few studies have assessed life expectancy relative to income or standard of living (Chetty et al.). Such studies require data on age at death and overall income, which are available now in France since taxation data have been included in the permanent demographic sample¹ (Blanpain).
Thirteen years’ difference between the most affluent and the poorest men
In France, the average standard of living² in the most affluent 5% of the population was €5,800 per month in 2012-2016. Men in the most affluent 5% had a life expectancy at birth of 84.4 years (Figure 1). At the other end of the scale, in the poorest 5%, the average standard of living was €470 per month and male life expectancy was 71.7 years.³ So, on average, the most affluent men live 13 years longer than the poorest. For women, the gap is smaller: life expectancy at birth for women in the most affluent 5% of the population is 88.3 years, compared with 80.0 years in the poorest 5% (an eight-year difference).
Up to 0.9 more years of life expectancy per additional 100 euros
Life expectancy increases with standard of living, for both men and women. However, the gain in life expectancy from a slight increase in standard of living is not the same for everyone. The more affluent you are, the less you gain. So, with a standard of living of around €1,000 per month, an additional €100 will increase life expectancy by 0.9 years for men and 0.7 years for women. With around €2,000 per month, the gain in life expectancy is just 0.3 years for men and 0.2 years for women. With €2,500 per month, it is only 0.2 and 0.1 years respectively.
It is better to be wealthy with no qualifications than poor and well qualified
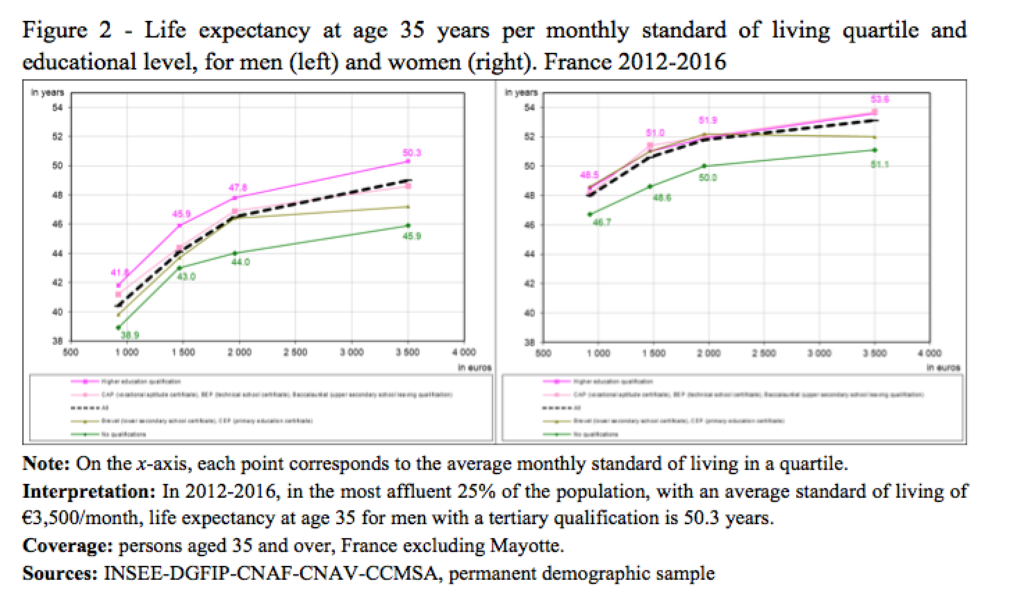
Life expectancy increases with standard of living regardless of education (Figure 2). So, the fact that life expectancy increases with affluence cannot be explained by educational level alone. Among men with no qualifications for example, life expectancy at age 35 is 46 years for the most affluent 25% compared with 39 years for the poorest 25%, i.e. a seven-year difference. In the most highly educated population, there is an eight-year difference between men in the most affluent 25% and those in the poorest 25%. Furthermore, men who are in the most affluent group but have no qualifications live longer beyond the age of 35 than the poorest university graduates (46 years vs. 42).

Why do more affluent people live longer?
Standard of living may have a direct effect on health status and therefore on longevity. Financial difficulties may be a barrier to healthcare. For example, 11% of adults in the poorest 20% of the population report having foregone a visit to the doctor in the past year for financial reasons, compared with 1% of adults in the most affluent 20% (Célant et al.). The standard of living also has an indirect impact on health because it is linked to other factors that affect health status, such as social class, education or area of residence. Managers have a high standard of living and are less vulnerable to occupational risks than manual workers. Likewise, unhealthy behaviours are more common among the low educated than among the highly educated. For example, in the 15-64 age bracket, 39% of people with no qualifications smoke every day, compared with just 21% of those with a tertiary qualification (Pasquereau et al.). Furthermore, a low standard of living may be the consequence of poor health rather than the cause. Poor health may prevent people from studying, working or getting a qualified job. Lastly, the ability to overcome or avoid illness and accidents could be linked to high earning capacity. For example, earning a high salary despite a lack of qualifications might reflect both strong professional and personal health skills.
This study reveals greater than average differences in life expectancy between two population groups, for example between managers and manual workers or between the high and low educated. It also shows that there is no threshold above which life expectancy no longer increases, at least up to the last standard of living ventile. So, even though the gain in life expectancy per additional €100 decreases as the standard of living rises, the life expectancy of a given ventile is always greater than that of the ventile below. Poor people do not live as long as those with an average standard of living. People with an average standard of living do not live as long as affluent people. And even affluent people do not live as long as very affluent people.
Footnote
¹ The permanent demographic sample comprises census information on 1/100th of the census population up to 2007, and 4/100ths from 2008 onwards. It also contains information from the civil register (including deaths), and tax and welfare data dating back to 2011. It is thus possible to monitor mortality in a very broad sample of individuals (around 11 million person-years between 2012 and 2016) over time in relation to their sociodemographic characteristics, as recorded in the census survey or in the tax and welfare data (for example, their standard of living).
² Standard of living is the disposable income of the household divided by the number of consumption units. A household’s disposable income includes earned income, income from assets, income transferred from other households and social benefits, net of direct tax. The number of consumption units depends on the size of the household and the age of those in it: one unit is allocated to the first adult, 0.5 to each additional person aged 14 years or over, and 0.3 to each child under the age of 14.
³ In 2012-2016, male life expectancy was 79.0 years and female life expectancy 85.2 years.
