The ultimate form of health inequality is death. Combining the concepts of region, division, and urban-rural residence in the U.S., Wesley James, Jeralynn Cossman, Julia Wolf highlight variation in mortality to ask and answer the question: what place has the worst mortality and how bad is it?
Background
Our work looks at the ultimate form of health inequality – death. Morbidity (i.e., illness, disease) and mortality (i.e., death) outcomes are not equally distributed across the United States. Mortality is used frequently as a measure of societal well-being and age, sex and race based differences are well known. Mortality rates also vary by socioeconomic status, typically measured by education and income.
Geographic — or spatial — disparities are less clearly known, however, largely because of varying definitions of “place.” In our work, place refers to three different concepts:
1) region (i.e., Northeast, Midwest, South, and West),
2) division (e.g., East South Central), and
3) urban vs. rural (using the Rural Urban Continuum Codes).
Historically, research has shown that health outcomes (like mortality) were bad in the South and in cities. Recent work has shed light on the increasingly poor health outcomes experienced in rural America as of the mid-1980s, labeling it the “Rural Mortality Penalty”.
There is a strong correlation between place and death when looking from a macro perspective —that is, focusing on the forest rather than the trees. We cannot say that a specific person is more likely to die because of where they live, but some places have higher (or lower) death rates than others. Residents of a place continuously change, but the health characteristics of those places typically stay the same; they are persistent. We have continued to build upon the mounting evidence that rural America is trending the wrong way on death statistics, and in our most recent work (James, Cossman and Wolf 2018) we do so by combining the concepts of region, division, and urban-rural to find variation in mortality based on where people reside to answer the question: what place has it the worst and how bad is it?
Persistent clusters of mortality
Our work takes a new perspective on place-based mortality disparities, expanding upon prior research on the Rural Mortality Penalty (Cosby et al. 2008; Cossman et al. 2010; James 2014), by examining disparities in mortality persistence across combinations of urban/rural-region and urban/rural-division classifications. Spatial persistence in mortality is important because it implies something greater is acting on these places over time; additionally, it sheds light on the classic question in morbidity and mortality studies of whether the determination of an outcome is more associated with characteristics of its people or characteristics of the place.
We know that mortality is higher in rural than urban places and in Southern than non-Southern places, but what about rural Southern places, or urban non-Southern places?
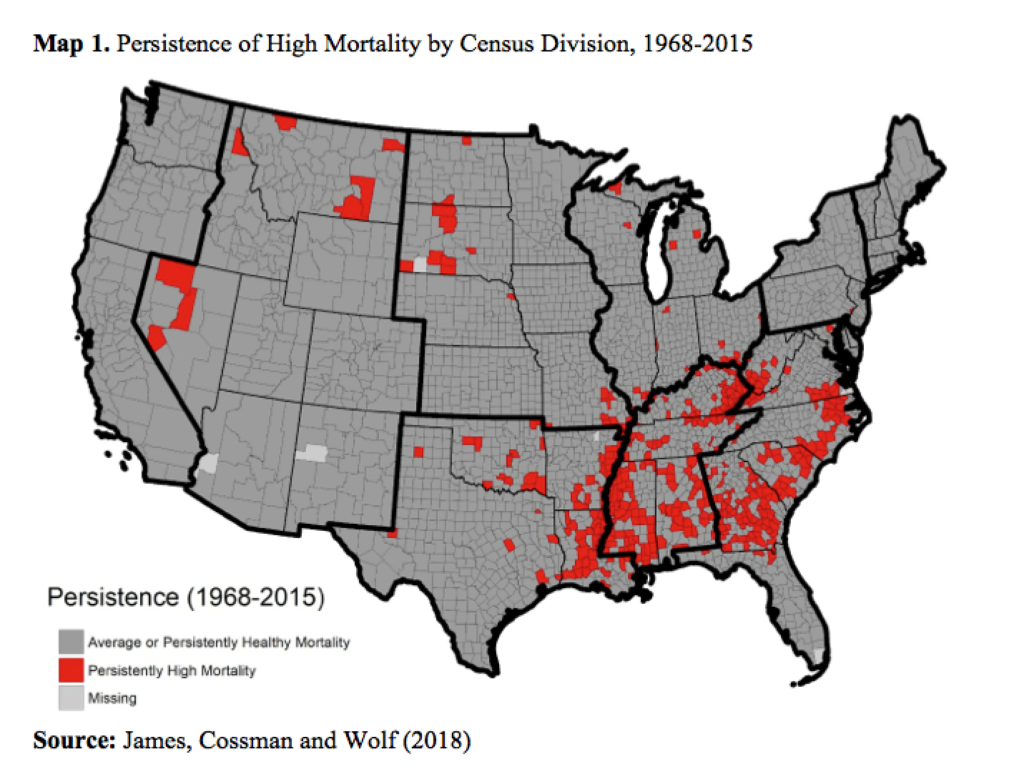
Map 1 provides a first glance into where persistence of high mortality clusters at the county-level. The red counties indicate places that experience unusually high death rates for nearly fifty years, the gray counties are those that do not. For scholars of demography and population health, these geographic disparities are not surprising. Upon closer look, the red counties cluster not only in the South but particularly in the middle of the South, that is, the East South Central (ESC) division as defined by the U.S. Bureau of the Census as Kentucky, Tennessee, Mississippi, and Alabama.

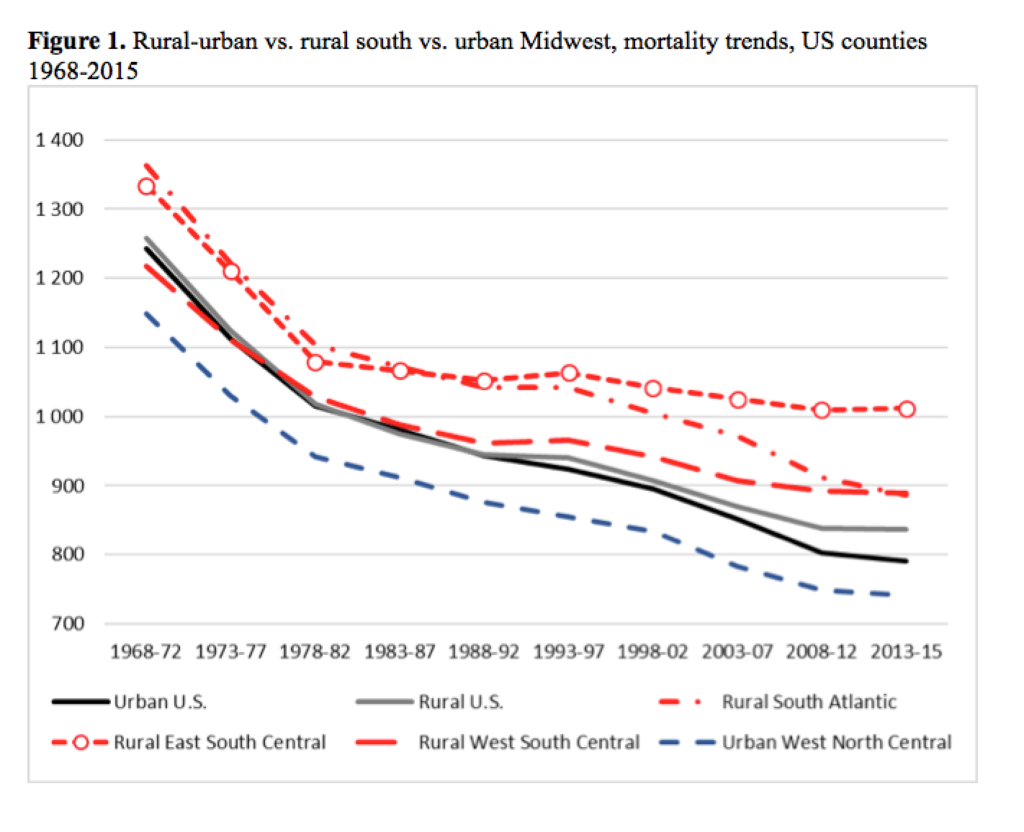
While the map informs us of region and division differences in persistence of mortality, it does not specifically address the rural-urban concept of place. Figure 1 does exactly that. The solid black and gray lines plot the Rural Mortality Penalty. The red dashed lines indicate the different death rates for the rural parts of each southern division and the blue dashed line indicates the death rates for the urban parts of the West North Central (WNC) division in the Midwest region. The distance between the top red line and the bottom blue line is substantial. These regional differences have not been explored to the same extent that rural and urban differences have. So, what are these places?
The poorest outcomes are in places of less than 20,000 county residents in the middle of the South and the best outcomes are in places of more than 250,000 residents in the upper Midwest. The disparity in death rates exceeds 250 deaths per 100,000, which equals hundreds of thousands of deaths accumulated over several years in the rural South that would have been prevented/delayed given equal rates of death to the more privileged urban western north central regions. The other two southern divisions (West South Central and South Atlantic) do not compare favorably to the urban Midwest either, but they are not trending in the wrong direction as is seen in the rural ESC.

Conclusion and implications
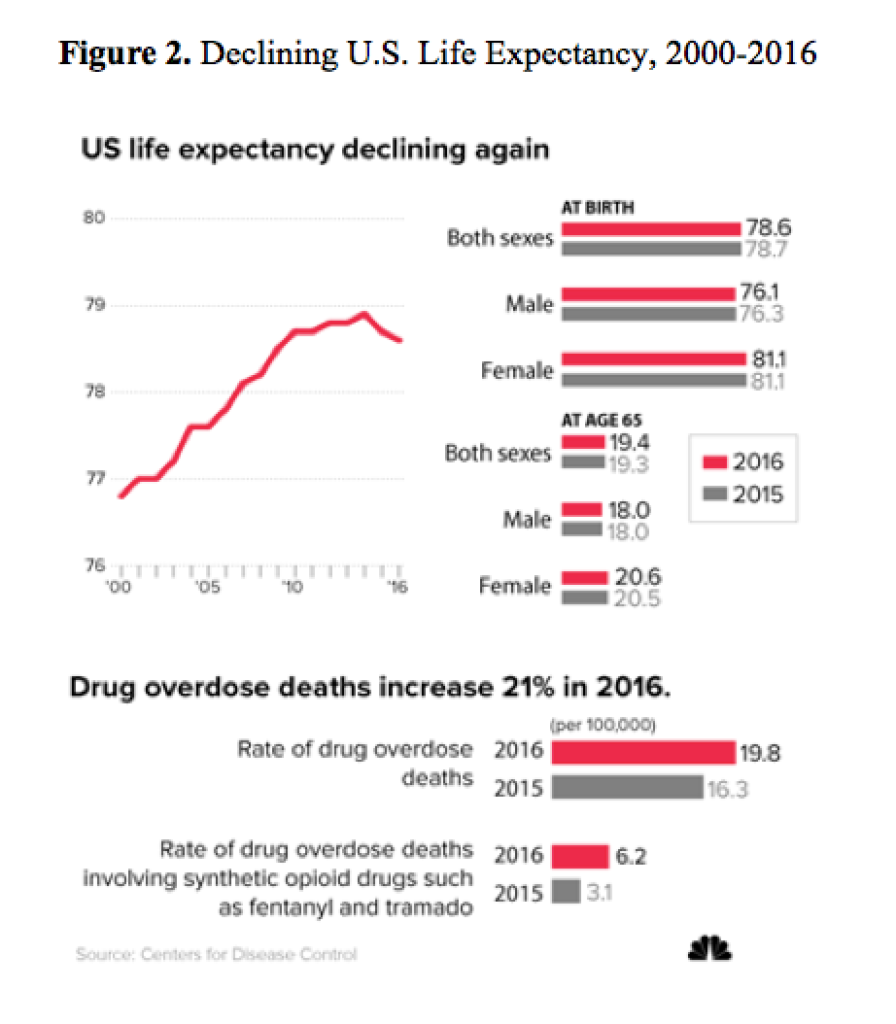
The issue of unhealthy places is uniquely relevant at this moment in time, as life expectancy in the U.S. has decreased for the second year in a row, a statistical outlier that has not been observed in more than 50 years, as shown in Figure 2 (Fox 2017).

There are three suspected drivers of this trend:
1) an increase in drug/opioid use,
2) smoking behaviors are more attributable to mortality in the South Central states than in other divisions (Fenelon 2013), and
3) the historical concentration of poverty in the rural South has been associated with mortality for decades (Fenelon 2013).
Considering that the East South Central division contains roughly 19 million people, an estimated 6,600 excess deaths occurs annually given the mortality disparity. The slow rate of improvement in the rural ESC counties is one of the main drivers of the persistent mortality disadvantage. Unfortunately, many in the rural South are falling behind in the race for longevity and good health. We conclude by answering the original question; what place has it the worst and how bad is it? Rural Dixieland has it far worse than the urban Heartland—in a landslide.
References
Cosby, A., Neaves, T., Cossman, R., Cossman, J., James, W., Feierabend, N., Mirvis, D., Jones, C., and Farrigan, T. (2008). Preliminary evidence for an emerging non-metropolitan mortality penalty in the United States. American Journal of Public Health 98(8): 1470–1472. doi:10.2105/AJPH.2007.123778.
Cossman, J., James, W., Cosby, A., and Cossman, R. (2010). Underlying causes of the emerging nonmetropolitan mortality penalty. American Journal of Public Health 100(8): 1417–1419. doi:10.2105/AJPH.2009.174185.
Fenelon, A. (2013). Geographic divergence in mortality in the United States. Population Development Review 39(4): 611–634. doi:10.1111/j.1728-4457.2013.00630.x.
Fox, M. (2017, December 21). U.S. life expectancy falls for second straight year: As drug overdoses soar. NBC News.
James W. (2014). All rural places are not created equal: Revisiting the rural mortality penalty in the United States. American Journal of Public Health 104(11): 2122–2129. doi:10.2105/AJPH.2014.301989.
James W., Cossman J., Wolf J. (2018). Persistence of death in the United States: The remarkably different mortality patterns between America’s Heartland and Dixieland, Demographic Research 33: 897–910


