In addition to the commonly used fertility measures, Ryohei Mogi, Jessica Nisén, and Vladimir Canudas-Romo suggest an alternative approach to the study of first birth behaviour, focusing on how long women live childless. A visual decomposition analysis shows how different cohorts contribute to cross-country differences in the length of childless life.
Postponement (Kohler et al. 2002) and foregoing (Kreyenfeld and Konietzka 2017) of parenthood have been important family demographic trends of the past half-century in the developed world. The common indexes used to describe first birth patterns (such as age-specific first birth rates, mean age at first birth, proportion of women remaining childless), tend to focus on a specific dimension (timing or quantum) but risk losing sight of the general picture. We propose an alternative measure, the cross-sectional average length of life childless, or CALC (Mogi et al. 2021).
How many of their reproductive years do women spend childless?
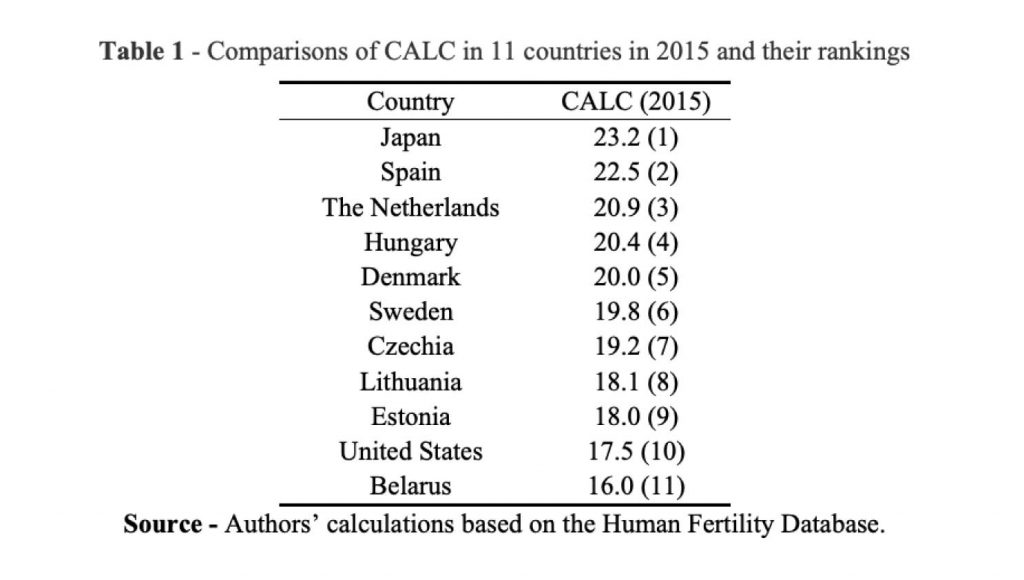
Table 1 shows CALC in 2015 in 11 selected countries where CALC tends to be high, frequently representing more than half of a woman’s reproductive life (between ages 12 and 49), i.e. more than 19 years. Japan and Spain record the highest values: in 2015, women in these countries spent, on average, almost 60 per cent of their reproductive lives without children (23.2 and 22.5 years in Japan and Spain, respectively). In Czechia, Denmark, Hungary, the Netherlands, and Sweden, CALC ranges between 19.2 and 20.9 years. Sweden lies in the middle, at 19.8 years. The lowest values are found in Belarus and the United States, where women remain childless for 16.0 and 17.5 years, respectively.

These examples clearly illustrate that CALC may reflect trends in both timing and quantum of first births. For instance, Japan and Spain are characterized by both late timing of first births as well as high levels of lifetime childlessness, while early timing and low levels of lifetime childlessness are common in Belarus and the United States.
Contribution of ages and cohorts to the difference in CALC
Japan
Using Sweden (median value) as a standard of reference, we can better appreciate how ages and cohorts contribute to high or low values of our index (CALC) in three selected cases: Hungary, Japan, and the United States (see also the interactive online application: https://rmogi.shinyapps.io/CALC/).
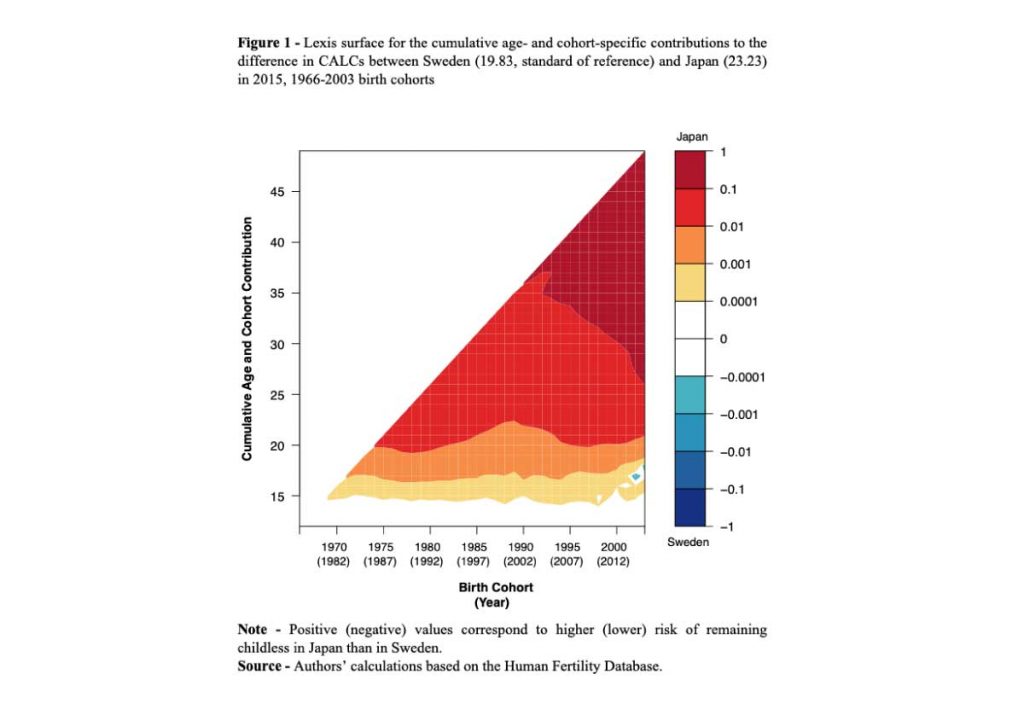
Sweden, our country of reference, is characterized by moderate levels of lifetime childlessness, and average-to-late timing of first births, with a notable catch-up at higher ages (Andersson et al. 2009, Kreyenfeld and Konietzka 2017). Compared to their Swedish counterparts, Japanese women have a greater risk of being childless across all reproductive ages and cohorts, and their CALC was particularly high in 2015 (Figure 1). Younger cohorts of women in Japan are contributing to an even higher expectation of childless life from increasingly early ages, probably a reflection of their later marriage and lower marriage rates (NIPSSR 2019).

Sweden, our country of reference, is characterized by moderate levels of lifetime childlessness, and average-to-late timing of first births, with a notable catch-up at higher ages (Andersson et al. 2009, Kreyenfeld and Konietzka 2017). Compared to their Swedish counterparts, Japanese women have a greater risk of being childless across all reproductive ages and cohorts, and their CALC was particularly high in 2015 (Figure 1). Younger cohorts of women in Japan are contributing to an even higher expectation of childless life from increasingly early ages, probably a reflection of their later marriage and lower marriage rates (NIPSSR 2019).
United States
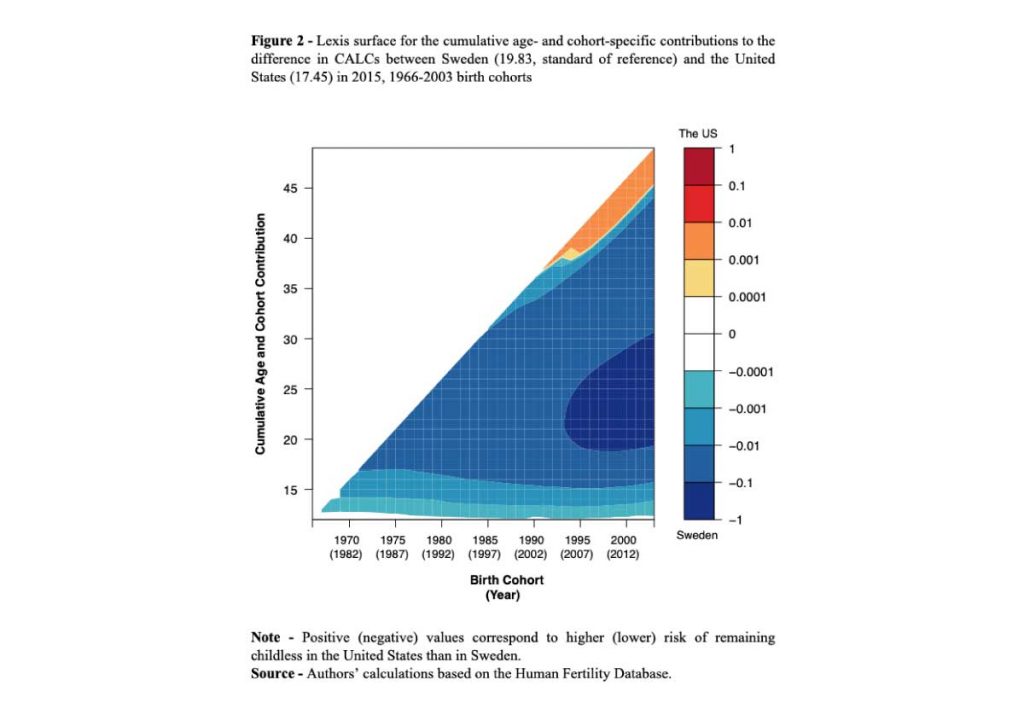
The decomposition of the difference in CALC between the United States and Sweden reflects the impact of high first birth rates at young ages in the United States and the catching-up process of childbearing in Sweden at later ages (at least among women born between the late 1960s and mid-1970s; Figure 2). In the younger cohorts, born in the mid-1970s or later, there are indications that the subgroup difference in life spent without children at reproductive ages in the United States is intensifying. Indeed, there is significant variation in first birth behaviour by race/ethnicity in the United States, because Hispanic white and Non-Hispanic African American women continue to enter motherhood earlier than Non-Hispanic white women (Sullivan 2005).

Hungary
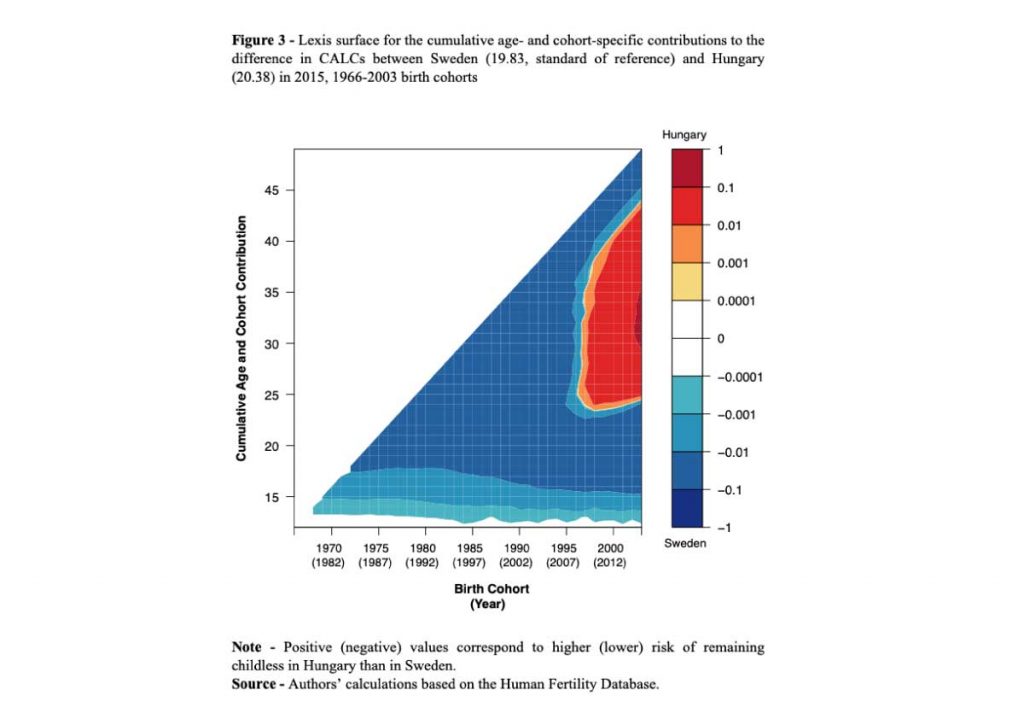
Finally, the decomposition of the difference in CALC between Hungary and Sweden is particularly interesting because it shows how different cohorts may be affected simultaneously at different ages, contrasting period and cohort effects on first births. In this case, the period effect occurs in the years following the onset of the Great Recession in 2007, which strongly affected fertility rates in many Central and Eastern European countries (Matysiak et al. 2020), and it seems probable that the recession is contributing to a longer expectation of childless life at reproductive ages in Hungary than in Sweden.

Concluding remarks
To conclude, CALC is a newly introduced measure that applies core demographic life table methodology to first births, shedding light on first birth patterns and trends and related cross-country differences. Further, visualization of the decomposition of differences between two CALCs provides a tool for illustrating how different cohorts and ages contribute to cross-country differences in the length of life childless during reproductive ages. This characteristic of CALC may be useful for policymakers, for instance, because specific population subgroups still in their reproductive ages may be identified and targeted, if considered necessary.
References
Kohler, H. P., Billari, F. C., & Ortega, J. A. (2002). The emergence of lowest-low fertility in Europe during the 1990s. Population and Development Review, 28(4), 641–680.
Kreyenfeld, M., & Konietzka, D. (2017). Childlessness in Europe: Contexts, Causes, and Consequences. Springer.
Matysiak, A., Sobotka, T., & Vignoli, D. (2020). The Great Recession and fertility in Europe: A sub-national analysis. European Journal of Population, 37, 29–64.
Mogi, R., Nisén, J., & Canudas-Romo, V. (2021). Cross-sectional average length of life childless. Demography, 58(1), 321–344.
National Institute of Population and Social Security Research (2019). Recent demographic statistics. National Institute of Population and Social Security Research [in Japanese].
Sullivan, R. (2005). The age pattern of first-birth rates among U.S women: The bimodel 1990s. Demography, 42(2), 259–273.


