Studies on the distribution of human development across the globe tend to omit the variations that exist within countries. Iñaki Permanyer and Jeroen Smits fill this gap by developing a sub-national version of the well-known Human Development Index across all world countries. Their findings uncover new layers of inequality in human development that were not previously observable.
Introduction
The Human Development Index (HDI) is a summary measure of achievement in key dimensions of human development: a long and healthy life, being knowledgeable and having a decent standard of living. Published on a yearly basis since 1990, the HDI has become the United Nations Development Program’s (UNDP’s) flagship indicator of development across the globe and one of the reference indicators to assess socio-economic performance of countries and regions.
A disadvantage of the HDI (shared with many other development indicators) is that for most countries it is only available at the national level, whereas, particularly in poor countries, there can be huge subnational variation: the farther one moves from capital and large cities, the weaker the educational and health facilities and economic opportunities tend to be. Indeed, the United Nations have included the ‘reduction of inequalities between and within countries’ as one of the key Sustainable Development Goals (SDGs) for the global development agenda in the coming decades.
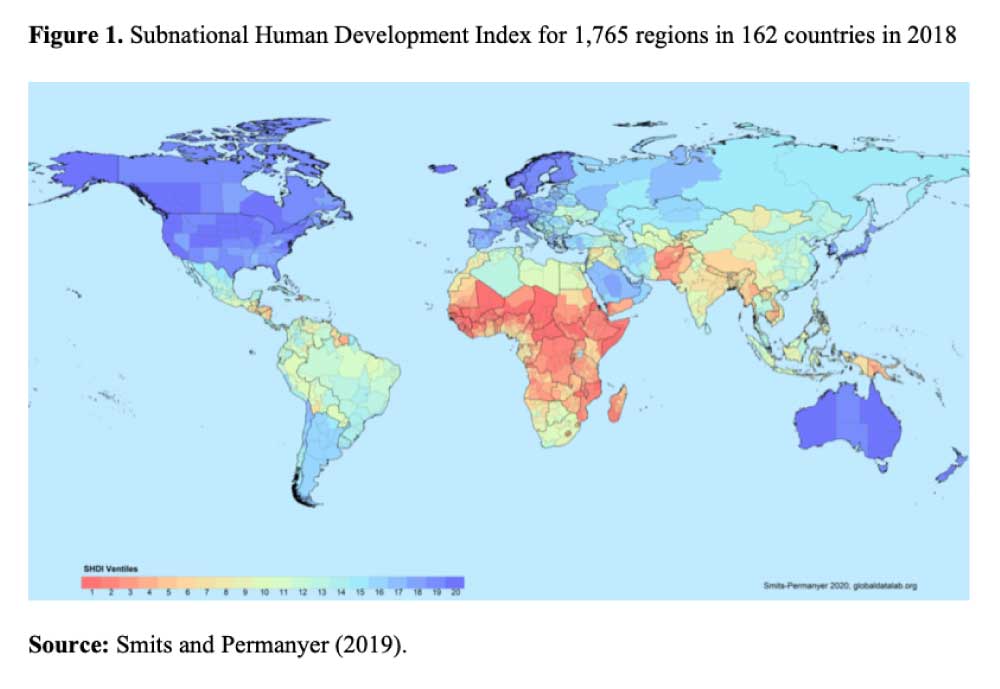
To address this issue, we developed the Subnational Human Development Database (SHDD) (Smits and Permanyer 2019), which provides a subnational version of the HDI, called SHDI, of its three underlying sub-indices (for education, health and standard of living), and of the four indicators used to compute these sub-indices. The SHDI and its sub-indices and indicators are currently available for over 1,765 regions within 162 countries, together covering more than 99% of the global population. They are constructed in such a way that their national averages coincide with those presented by the UNDP in the Human Development Reports and its underlying database.
Within-country inequality
Figure 1 shows how human development was distributed over the world in 2018. We observe substantial variation, both within and between countries (Permanyer & Smits 2020). In the most developed countries, the within-country variation is not very large: it amounts to 10-15 percent of total inequality. These countries have enough resources to arrange reasonable educational and health facilities also in their more remote and rural areas.

For countries at a low or middle level of human development, the situation is different. In these countries, the central regions and major cities may have already reached a reasonable level of human development, but the more remote and rural areas are often lagging behind. In the groups of “low” and “middle developed” countries (where 70 percent of the global population lives) total inequality in human development almost doubles when within-country inequality is included in the picture.
Of the underlying sub-dimensions, education is most important in explaining the within-country variation in HDI. In low developed countries, it explains about two-thirds of the variation in SHDI, at the middle level of development about 50 percent, and at the highest levels of development still about 45 percent. Standard of living is not so important in low development countries, but becomes more important as the level of development rises. At the highest level of development, it is the most important dimension, explaining about half of the subnational variation in SHDI.
Trends in SHDI
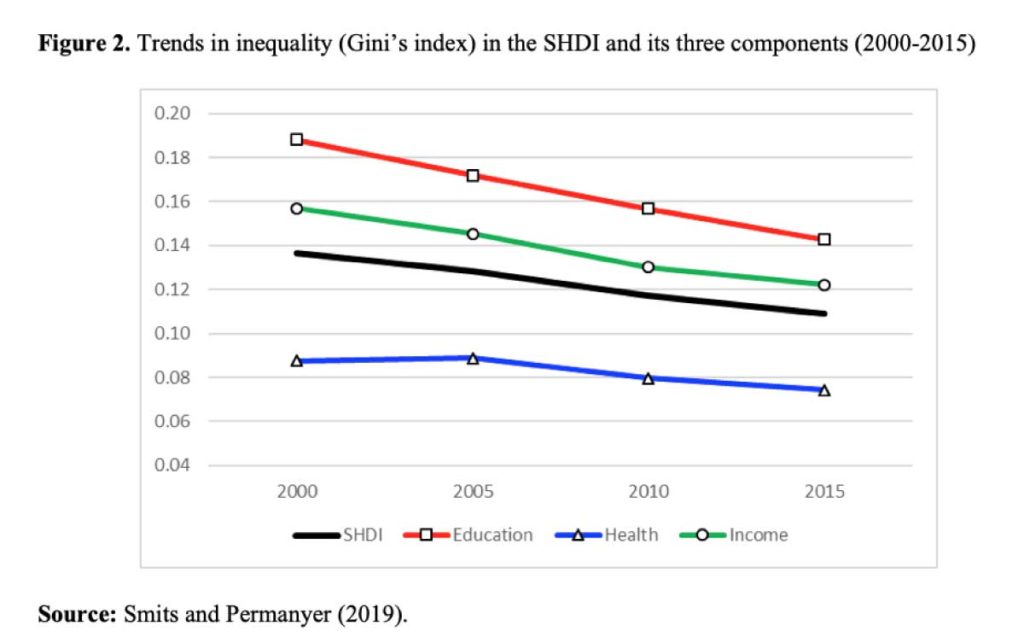
Figure 2 shows that global differences in human development have declined in recent decades. The Gini coefficient of SHDI inequality decreased from 0.14 to 0.11 between 2000 and 2015. This is also true for the three underlying dimension indices. Inequality in the education dimension – which was highest in 2000 – decreased the most, followed by the income dimension. Inequality in health decreased much less, but with a Gini of 0.08, this dimension was already the most equal one in 2000.

Further analysis of the changes over time revealed that the decrease in inequality in the SHDI and its three indices over this period was to a large extent the result of decreasing inequality between countries. Inequality within countries has decreased much less, which means that the within-country component of global inequality has become relatively more important. We also found population growth to be an inequality-enhancing factor, as it was highest in the regions with the lowest levels of development. Given the very high predicted population growth in the sub-Saharan African region (UN, 2019), this inequality-increasing effect might become stronger in the coming years.
The observed declines in global SHDI inequality, both between and (less so) within countries, are a success story that goes against diverging trends dating back in time as far as the onset of the Industrial Revolution (Bourguignon and Morrisson 2002). However, most of the documented global convergence is with regard to “basic” capabilities linked to essential needs, including survival, literacy and reduction of extreme poverty. At the same time, there are indications that these positive changes occur in tandem with increasing inequalities in “advanced” capabilities which will become crucial in the near future, like healthy ageing, college education, or high quality skills (Permanyer and Scholl 2019, Human Development Report 2019). Hence convergence at the bottom of the distribution may coexist with new layers of inequality at its top. This should be taken into consideration by researchers and policy-makers concerned with global distributive justice in the 21st century.
Covid-19
Recently the UNDP sounded the alarm because the coronavirus pandemic might decrease the level of human development in the world for the first time since measurements began (UNDP, 2020). The virus might wipe out the gains made in recent years as it negatively impacts all three pillars of human development: health, education and standard of living. To prevent this from happening it seems essential to identify the places that are most vulnerable due to high levels of poverty and weak health and educational systems. The SHDI database might be very useful in this respect, both in its synthetic and analytic (by component) version. These indices may help to identify hotspots of vulnerability, and to understand why the virus hits harder in some places than in others.
References
Bourguignon F., Morrisson C. (2002) “Inequality among world citizens: 1820-1992”, American Economic Review, 92(4):727-744.
Permanyer I., Scholl N. (2019) “Global trends in lifespan inequality: 1950-2015”, PLoS-ONE, 15(5): e0215742.
Permanyer I., Smits J. (2020) “Inequality in human development across the globe”, Population and Development Review, First published: 16 July 2020, https://doi.org/10.1111/padr.12343.
Smits J., Permanyer I. (2019) “The Subnational Human Development Index Database”, Scientific data, 6: 190038.
UN (2019). World Population Prospects 2019: Highlights. United Nations, Department of Economic and Social Affairs, Population Division. ST/ESA/SER.A/423.
UNDP (2020). Covid-19 and Human Development: Assessing the crisis, envisioning the recovery. 2020 Human Development Perspectives. New York: United Nations Development Program.


