Statistics on euthanasia and assisted suicides are rarely available, in part because very few countries have legalized this form of end of life, and usually only in recent or very recent years. This lack of information, as Gianpiero Dalla-Zuanna and Asher D. Colombo argue, does not help informed policy choices, especially on such a sensitive issue.
Concerning the last stage of life, three processes have changed and continue to change, both in developed countries and, increasingly so, also in developing countries. The first is demographic, and refers to the considerable survival gains achieved in recent years. However, many of the years gained are lived in poor health. The second is cultural. A growing share of the population believes that the length of one’s existence should no longer be governed by external factors – God or fate – but controlled at the individual level. The third is medical, with rapid advances in pain therapies, palliative care, and remedies for mental distress, the pain often associated with the last stage of life has been markedly reduced.
Since the end of the last century, some countries have decriminalized assisted dying or have introduced legislation allowing access to euthanasia or medically assisted suicide (EAS) for patients who request it, based on criteria that vary from country to country. The introduction of this new legislation was preceded and followed by heated debates concerning the potential effects of allowing people to end their life in these ways. Many of these debates, however, took place in a rather extensive knowledge vacuum, that we tried to fill in a recent paper (Colombo and Dalla-Zuanna 2024).
Growth, but with considerable variability
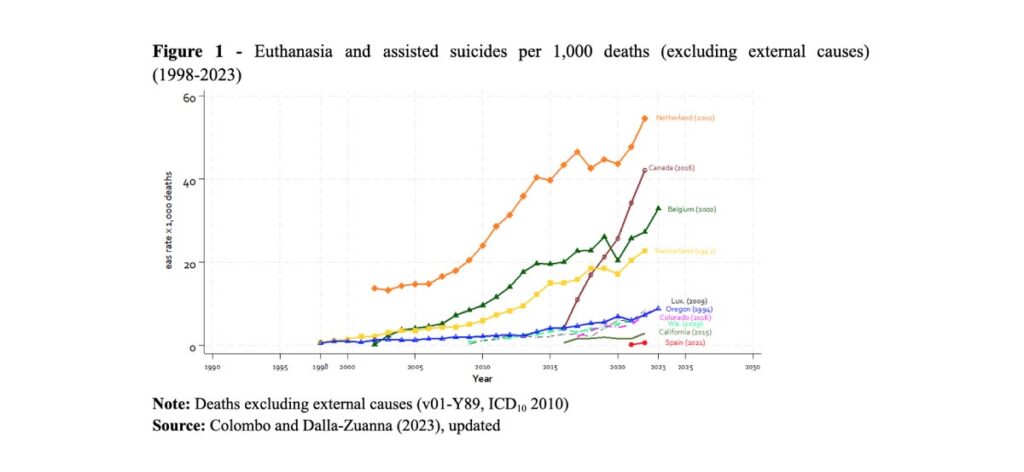
Figure 1 shows the main indicator used for the analysis, i.e. the number of deaths by euthanasia or assisted suicide (EAS) per 1,000 deaths, after removing deaths from external causes, i.e. due to injury, self-harm or interpersonal violence (codes V01 to Y89 of ICD-10, version 2010).

Wherever this legislation was introduced, a generalized growth in the proportion of EAS ensued, although levels differ considerably. In the Netherlands, in the past ten years, the share of nonviolent deaths attributable to some form of EAS has risen from 4.3% to more than 5%, with Switzerland (1.7%‒2.3%) and Belgium (2.0%‒3.3%) following at some distance. This share is much lower in all US states, at below 1%.
A close inspection of the graph suggests the existence of three groups of countries. The American states and Luxembourg, together with Spain (where the new law is very recent) have shown a modest increase, while growth in the European countries has been rapid. It is dwarfed, however, by that of Canada, where the startling and anomalous growth curve is much steeper than anywhere else.
Different starts, different rates of change
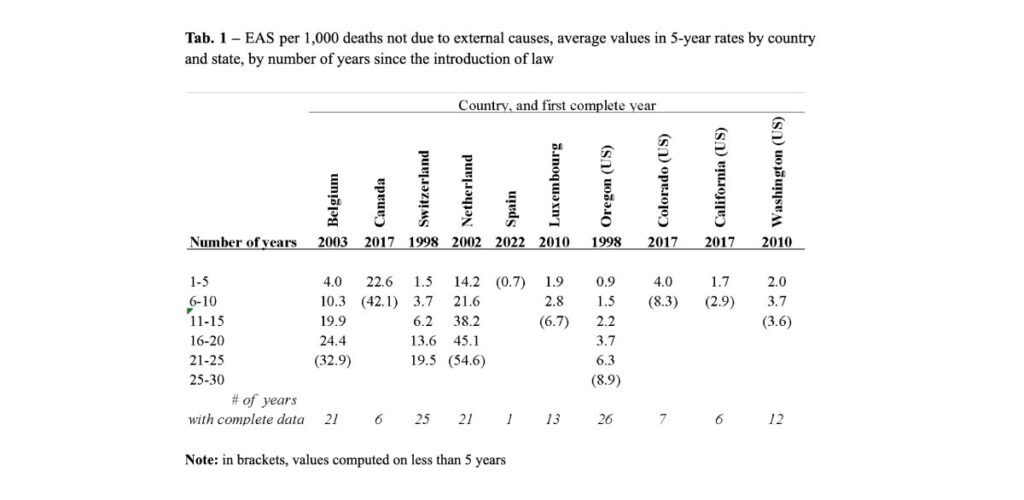
The interpretation of the trends shown so far may be influenced by the different years in which each country legalized EAS and, thus, by the different durations of the measure. Table 1 presents five-year rates of EAS deaths per 1,000 deaths not due to external causes from the first full year of introduction of the measure, also displayed in the table. Some countries and US states, such as Switzerland, Luxembourg, Spain, California, Washington, and Oregon, had a relatively slow start. In others, such as Belgium and Colorado, levels have been systematically higher from the outset, as is the case in the Netherlands, where assisted suicide had been decriminalized long before the 2001 law that made it legal, and Canada, definitely an outlier in this respect.

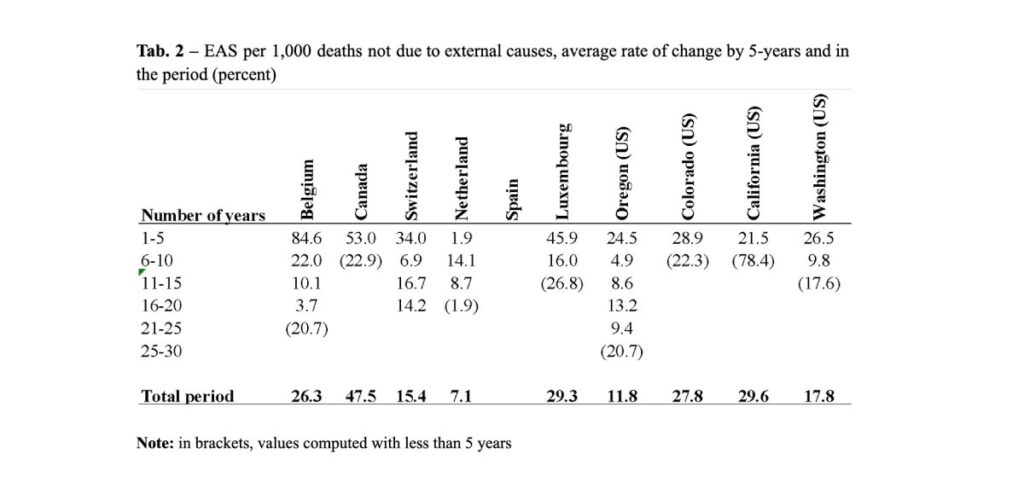
The speed of growth in the various countries also varies. Table 2 shows the average annual rate of increase in EAS for each five-year period of existence of the law. Growth was generally rapid at the beginning then slowed down later on. However, in many countries, it picked up again between the third and fourth five-year periods. The average annual growth rates are below 10% per year in the Netherlands and Oregon, between 10% and 20% in Switzerland, Oregon, Washington, and above 20% per year in Belgium, Luxembourg, and two US states (Colorado, California). Canada also stands out in this respect, with an EAS growth rate of almost 50% per year.
Research in this field is severely hampered by the lack of detailed and comparable data. Sources are limited to reports submitted by national authorities to their respective governments to evaluate health policies, and EAS-attributable deaths are not detailed in cause-of-death statistics. To advance research on this topic, it would be a major step forward if death certificates were to indicate whether euthanasia or assisted suicide is a (secondary) cause of death. This would give cross-country comparisons and national analyses much greater validity and depth. This could be done by including two new questions on the death certificate: “Was death induced by assisted suicide?” and “Was death induced by euthanasia?”. This choice would have the advantage of simplicity, separating the collection of this kind of information from the complex task of identifying causes of death.
References
Colombo A., Dalla-Zuanna G. 2024. Data and trends in assisted suicide and euthanasia, and some related demographic issues. Population and Development Review. 50 (1):233‒257.


