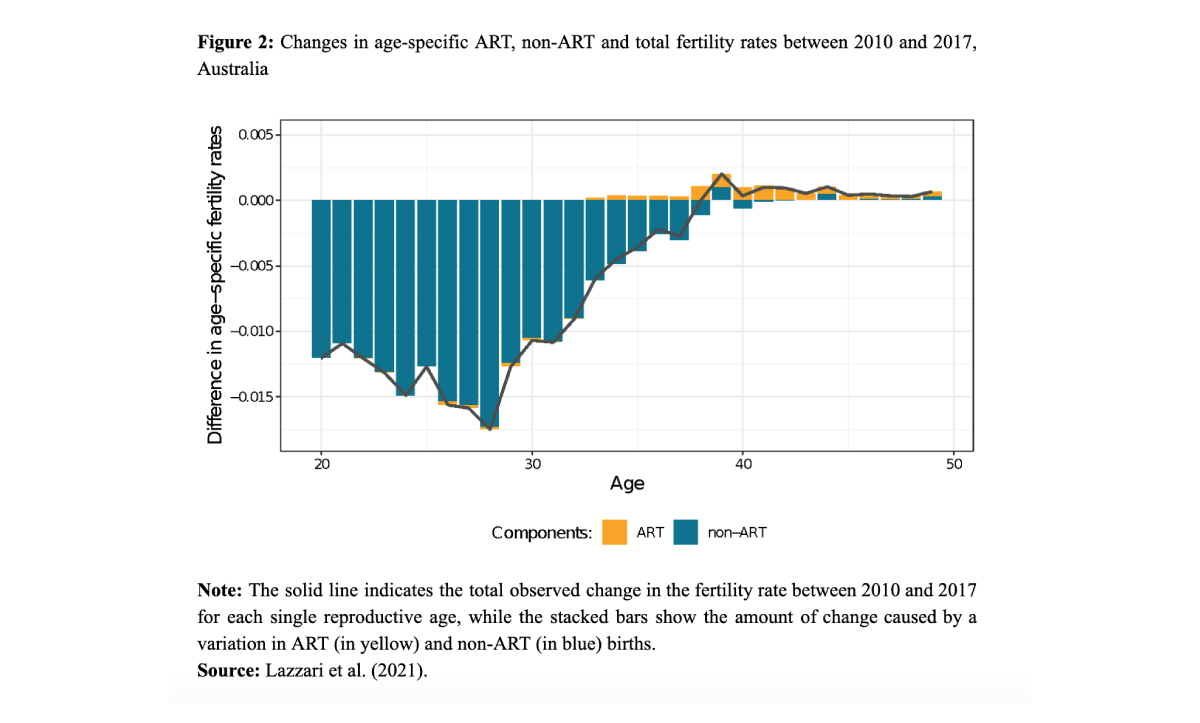
Figure-2-Changes-in-age-specific-ART-non-ART-and-total-fertility-rates-between-2010-and-2017-Australia-