

Higher survival, not low fertility, is the main long-term driver of population ageing. Adding some new elements to an old debate among demographers, Gustavo De Santis and Giambattista Salinari illustrate how they arrived at this conclusion and highlight some of the practical implications of their findings.
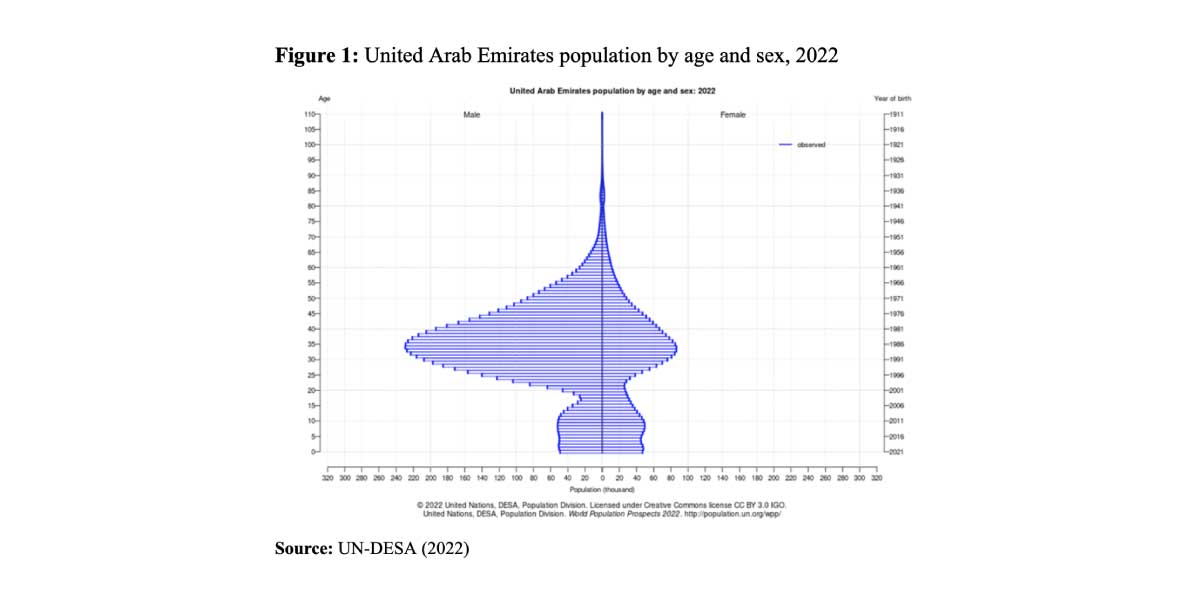
Demographers have long debated about the main drivers of population ageing. The contest is really only between fertility and mortality, as migration is known to play but a minor role, with the exception of small and peculiar realities (e.g. the United Arab Emirates in 2022 – Figure 1), and even then, usually just for limited periods of time.
The two opposing points of view are well summarized in these words:
Why are populations of rich countries so much older today than they were a century or two ago? … Common sense suggests that longer life is responsible for population ageing, but decades ago the work of demographers such as Coale (1956, 1957) and Keyfitz (1975) persuaded us that in fact fertility decline was more important. More recently, a new wave of demographic analysis suggests that mortality decline is the main demographic source of continuing population ageing. Here we … consider this possibility, but reject it.
(Lee and Zhou, 2017, pp. 285-287).
What do you think about it? And why should non-demographers care?
Levels and variations of old age measures
We recently addressed this issue in two distinct publications (De Santis and Salinari 2023, 2024). Our main conclusion is much closer to the “common sense” evoked in the above quote: the culprit of population ageing is longer average life spans. This is not particularly surprising, all in all, because the reason we can observe individuals living up to 40 years, for instance (which is not the case for mosquitoes), but not to the age of 1,000 (as it happens with sequoias), is that human mortality has certain characteristics, which translate into and shape population age structures (De Santis and Salinari, 2024).
Note, however, that there is a small ambiguity in this debate. Imagine you are interested in measuring the depth of the water of a large lake, where waves are frequent and high. Your indicator, an anchored cork in this example, will go up and down “erratically”, and predictions on direction and amount of change between two short-spaced instants depend on whether the cork is currently on the peak or a trough of a wave, how big the wave is, and when the next waves are due. On average, however, the cork will indicate the “normal” water level in that lake, which depends on the underlying structural and climatic conditions (e.g. average rainfall and its tendency to increase or decrease over time).
If we transpose this metaphor to the field of demography we can think of waves as “short-term disturbances” to the lake surface (=population age structure) produced by changes in number of births and, to a lesser degree, migrants. However, the underlying tendency towards higher or lower water level is due to more structural conditions (average rainfall).
Let us consider the average age as an indicator of population ageing. Alternatives are possible, of course, such as the old age dependency index, OADI, but nothing changes in practice (not shown here). We can calculate two versions of the average age. The “standard” one, At, is based on the observed population of age x at time t, Px,t. The “reference” one, A*t, is calculated instead on the stationary population at time t, Lx. As the stationary population derives from a (period) life table, which depends only on survival conditions (not fertility or migration), we can use it as a measure of what would happen to ageing (as measured by the average age At) if only current mortality mattered. All the rest (previous mortality, fertility and migration) goes into the difference between the expected (by us) value A*t and the observed value At.
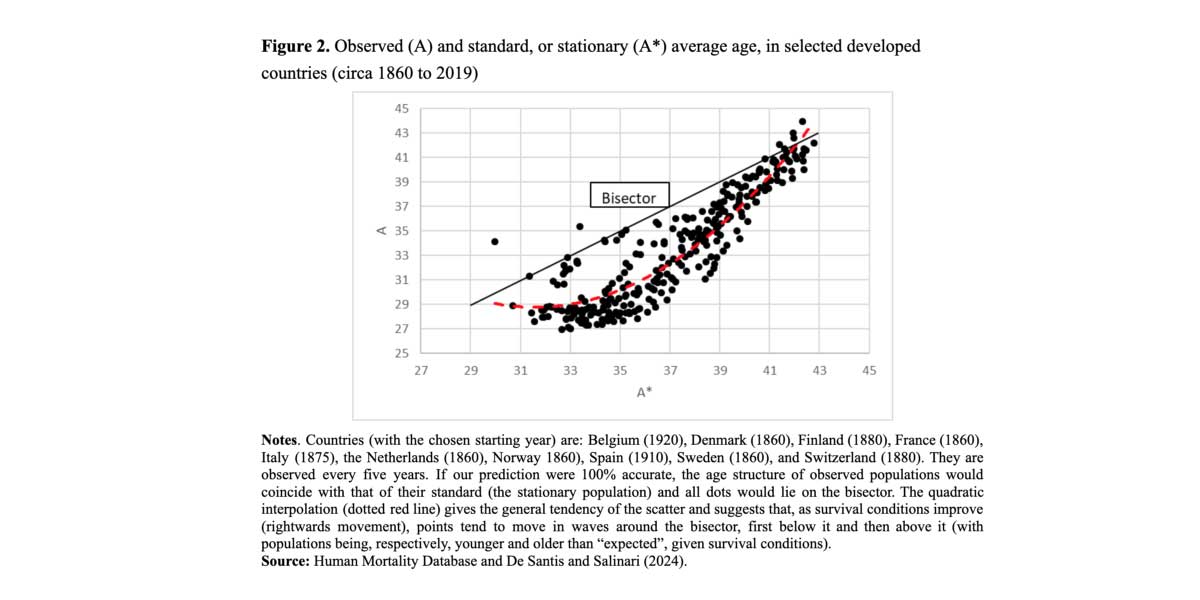
Figure 2 shows what can be observed in practice in a few selected developed countries, over a long time span. If the “waves” (fertility, migration and past mortality) had no effect on the observed age structure, all the points would lie on the bisector, where At=A*t, and where, in other words, 100% of ageing depends on survival. Moving rightwards (from low to high survival, so from low to high levels of ageing in the corresponding stationary populations), we observe instead that points move “in waves”. There is a rather large trough when A* is about 36 years (corresponding to an average length of life e0 of some 55/60 years), which historically occurred in the middle of the demographic transition – a very impressive wave indeed. For higher values of A*, however, after the end of the demographic transition, and up to today, things tend to return to “normal”. Our prediction is that new waves will hit the lake (starting from the ongoing second demographic transition), with new peaks and troughs, that will propagate and intersect with occasional new disturbances of all kinds. But A*t will always be a fairly good guide to the expected value of At.
Why should non-demographers care about all this?
If the age structure has effects on the socio-economic life of a community, understanding what drives its levels and change, both in the short and in the long run, matters for everybody, not just for population specialists and their academic discussions. The demographic bonus and pension systems, for example, are two areas where these ideas could potentially be applied.
The demographic bonus (or dividend, or window of opportunity) has traditionally been defined as a phase of “structural improvement” over a recent past. For instance, Lee and Mason (2010, p. S159) call it a “phase of … three to five decades … [when] support ratios rise well above their pre-transition levels”. We suggest that the comparison be made also with the stationary age structure of that time. This means that a demographic dividend can be considered to exist as long as the observed age structure is “better” than that of the corresponding stationary population.
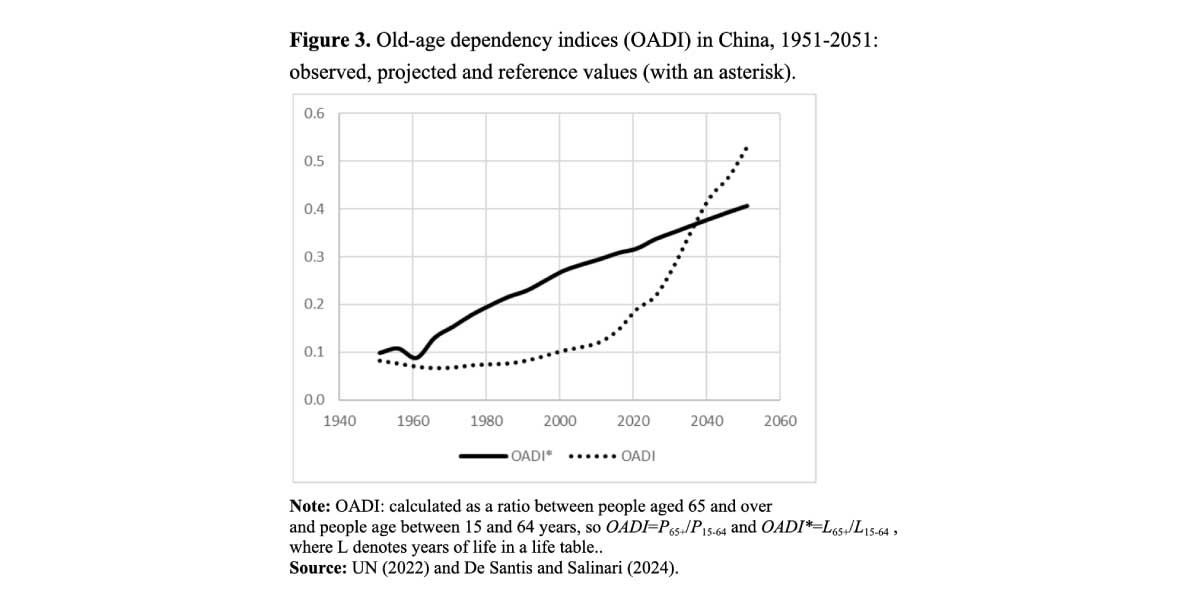
Let us refer to Figure 3, for instance. Due to its impressive fertility decline, China’s old-age dependency index (OADI) started to worsen (i.e. to increase) in the 1980s, and is now deteriorating rapidly. However, until about 2036, the observed OADI in China will be lower than its standard equivalent OADI*. In our interpretation, this means that, until then, China will still benefit from a demographic bonus, which means that it will be younger than what would be expected, based on survival level, although this advantage will shrink progressively as time passes.
Most pension systems have been reformed (retrenchments) in recent years due to population ageing. In several cases, these adjustments have been pegged to recent life tables and current survival conditions, and translate into higher retirement ages, or lower pension benefits (because retirees are expected to draw resources from the system for a longer period of time). Our findings suggest that this is the right approach, that it should become more widespread and systematic than is currently the case, and that it should be explicitly presented to the general public as a (comparatively small) price to pay for the great success of ever longer survival that benefits everyone.
Funding
We acknowledge co-funding from two sources: 1) Next Generation EU, in the context of the National Recovery and Resilience Plan, Investment PE8—Project Age-It: “Aging Well in an Aging Society’. This resource is co-financed by the Next-Generation EU (DM 1557 11.10.2022). 2) the Italian MUR (PRIN 2022–No. 2022CENE9F, “The pre-Covid-19 stall in life expectancy in Italy: looking for explanations”). The views and opinions expressed are only those of the authors and do not necessarily reflect those of the funding agencies.
References
Coale A.J. 1956. The effects of changes in mortality and fertility on age composition, Milbank Memorial Fund Quarterly, 34:79–114.
Coale A.J. 1957. How the age distribution of a human population is determined, Cold Spring Harbor Symposia on Quantitative Biology, 22.
De Santis G., Salinari G. 2023. “What drives population ageing? A cointegration analysis”, Statistical Methods and Applications, 32:1723–1741. https://doi.org/10.1007/s10260-023-00713-1
De Santis G., Salinari G. 2024. Long-term impact of mortality on population age structures. International Journal of Population Studies, https://doi.org/10.36922/ijps.377
Keyftz N. 1975. How do we know the facts of demography?, Population and Development Review, 1 (2): 267–288.
Lee R., Zhou Y. 2017. Does fertility or mortality drive contemporary population aging? The revisionist view revisited. Population and Development Review, 43:285–301. https://doi.org/10.1111/padr.12062.
United Nations. 2022. World Population Prospects: The 2022 Revision. New York, United Nations Publications.