According to the most recent estimates, under-five mortality¹ in India is decreasing, but the annual number of under-five deaths is still as high as 1.2 million, the largest in the world (UNICEF 2016), and several districts of India, which did not achieve the Millennium Development Goal No. 4, are “off track” for the Sustainable Development Goal No. 3.
A large part of under-five mortality is due to infant mortality, which is also declining but remains high: the most reliable data of the Sample Registration System (SRS) show that India’s infant mortality rate (IMR) decreased from 129 to 40 (per thousand live births) between 1971 and 2013.
Finally, as a large, and recently increasing, share of infant and under-five mortality is due to neonatal mortality, concern about this very early mortality has intensified in India. Previous studies focused mainly on individual-level determinants and the medical causes of neonatal deaths. But it is also worth considering the macro dimension of the problem, and to examine the trend, tempo, and quantum of changes in the neonatal mortality rate (NMR) at state level, assessing the amount of inequality across all states and between their urban and rural subpopulations (Saikia et al. 2016).
Regional patterns and the unequal speed of reduction
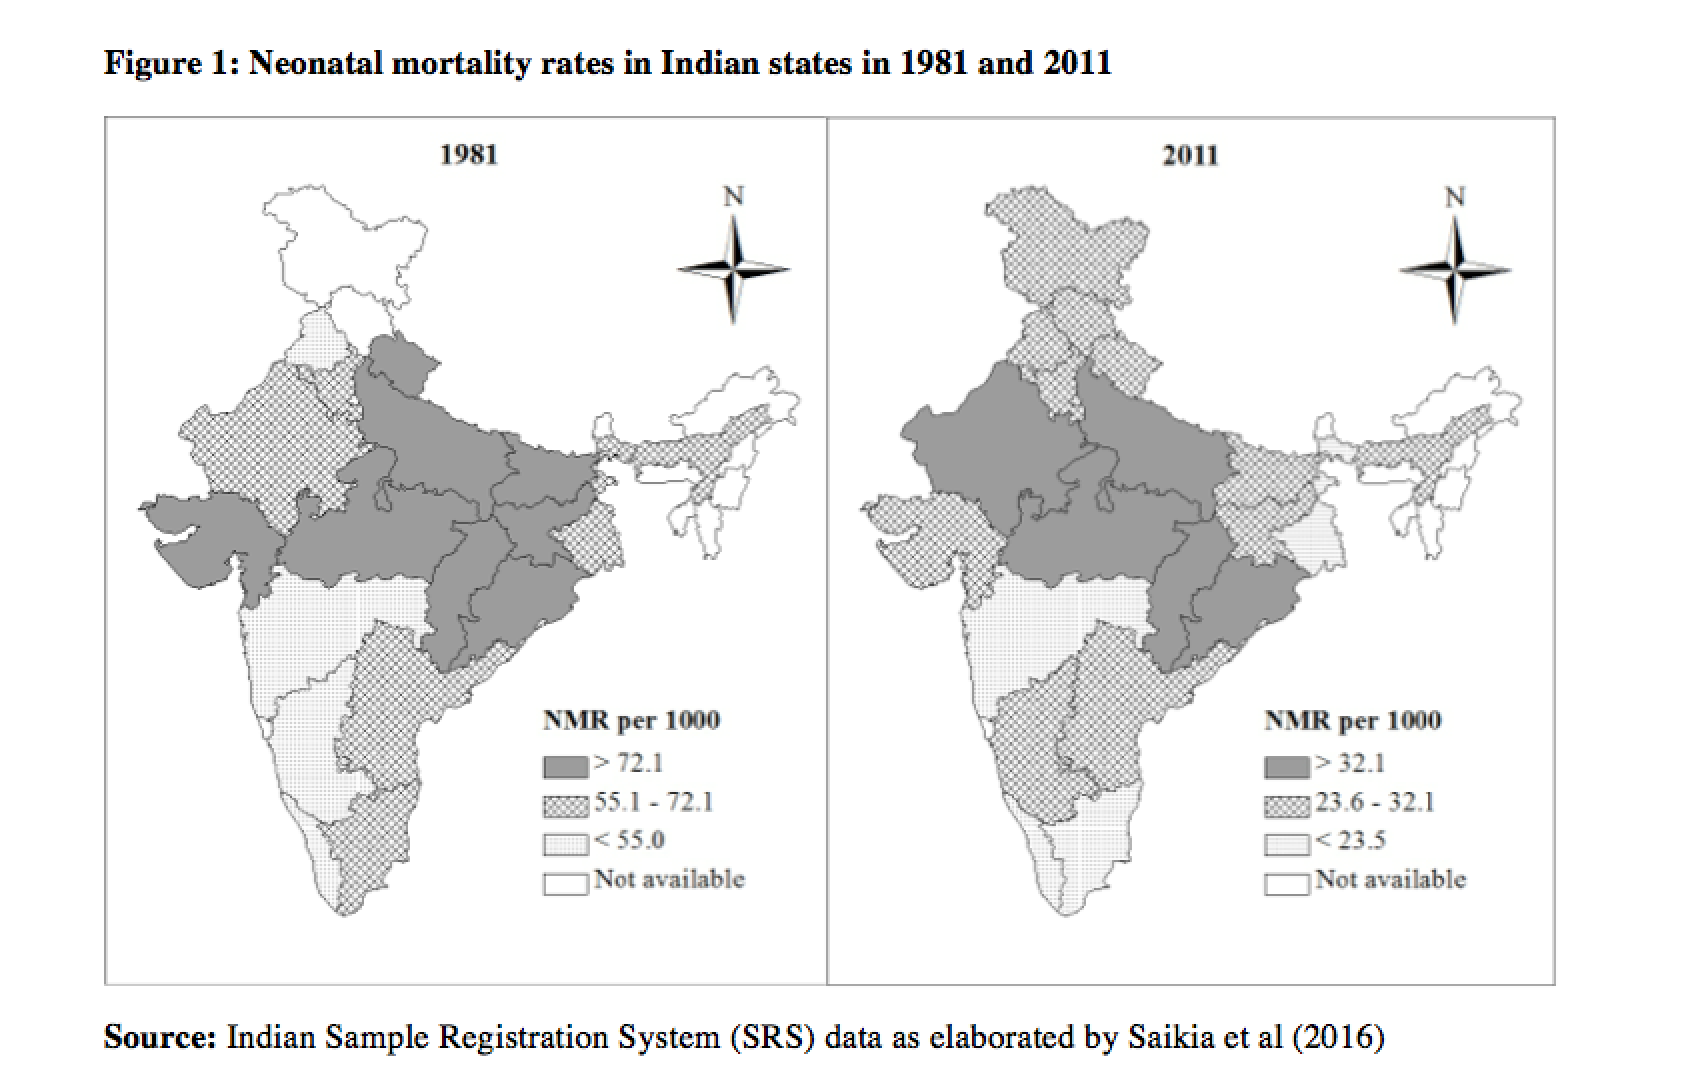
India’s regional pattern of neonatal mortality has remained almost unaltered in the past 30 years, with the centre-east lagging behind the south (Figure 1).
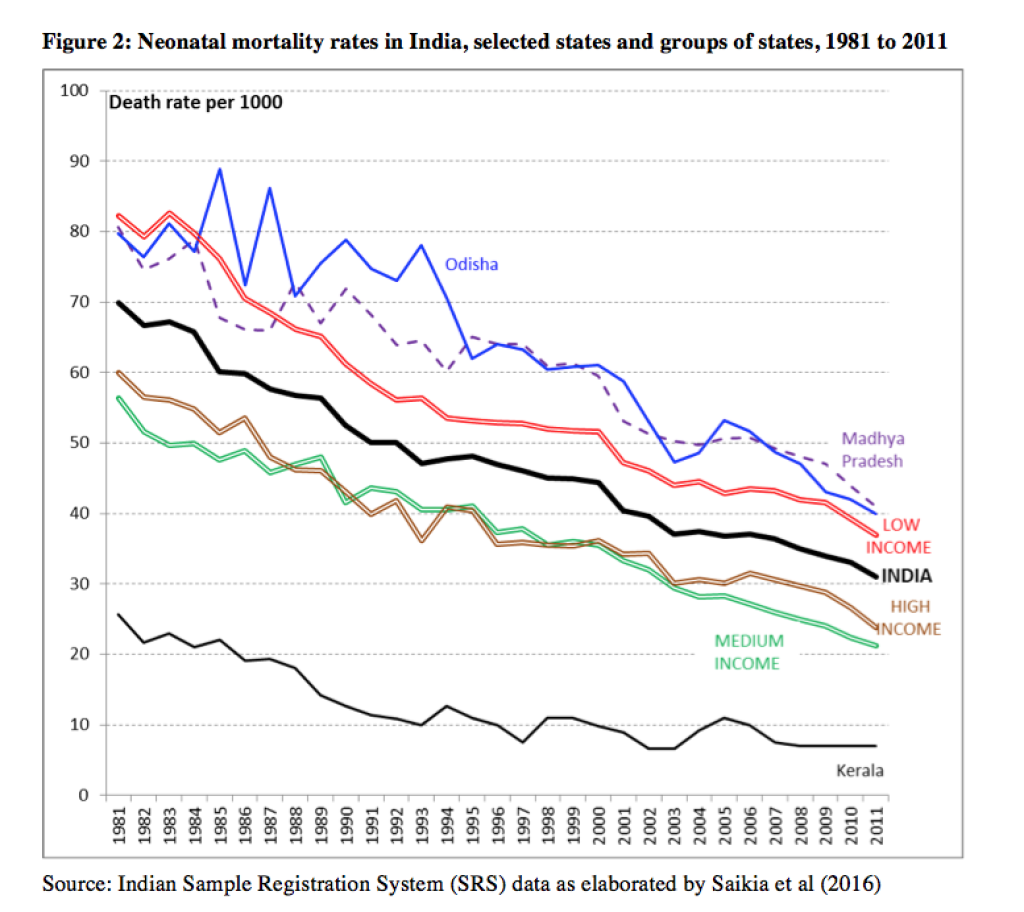
While the NMR generally declined over the period, a huge gap remains between the vanguard state of Kerala and laggard states such as Uttar Pradesh, Madhya Pradesh and Odisha (Figure 2). Besides, the NMR decline slowed down between 1993 and 2000 and again between 2003 and 2007, but not everywhere and, in particular, not in the medium-income group of states.
Note also that there is no simple correspondence between the socioeconomic gradient and neonatal mortality: for instance, the NMR has traditionally been very similar in medium- and high-income states, and since the early 2000s, it has been even lower in the group of medium-income states.
Persistent rural-urban divide
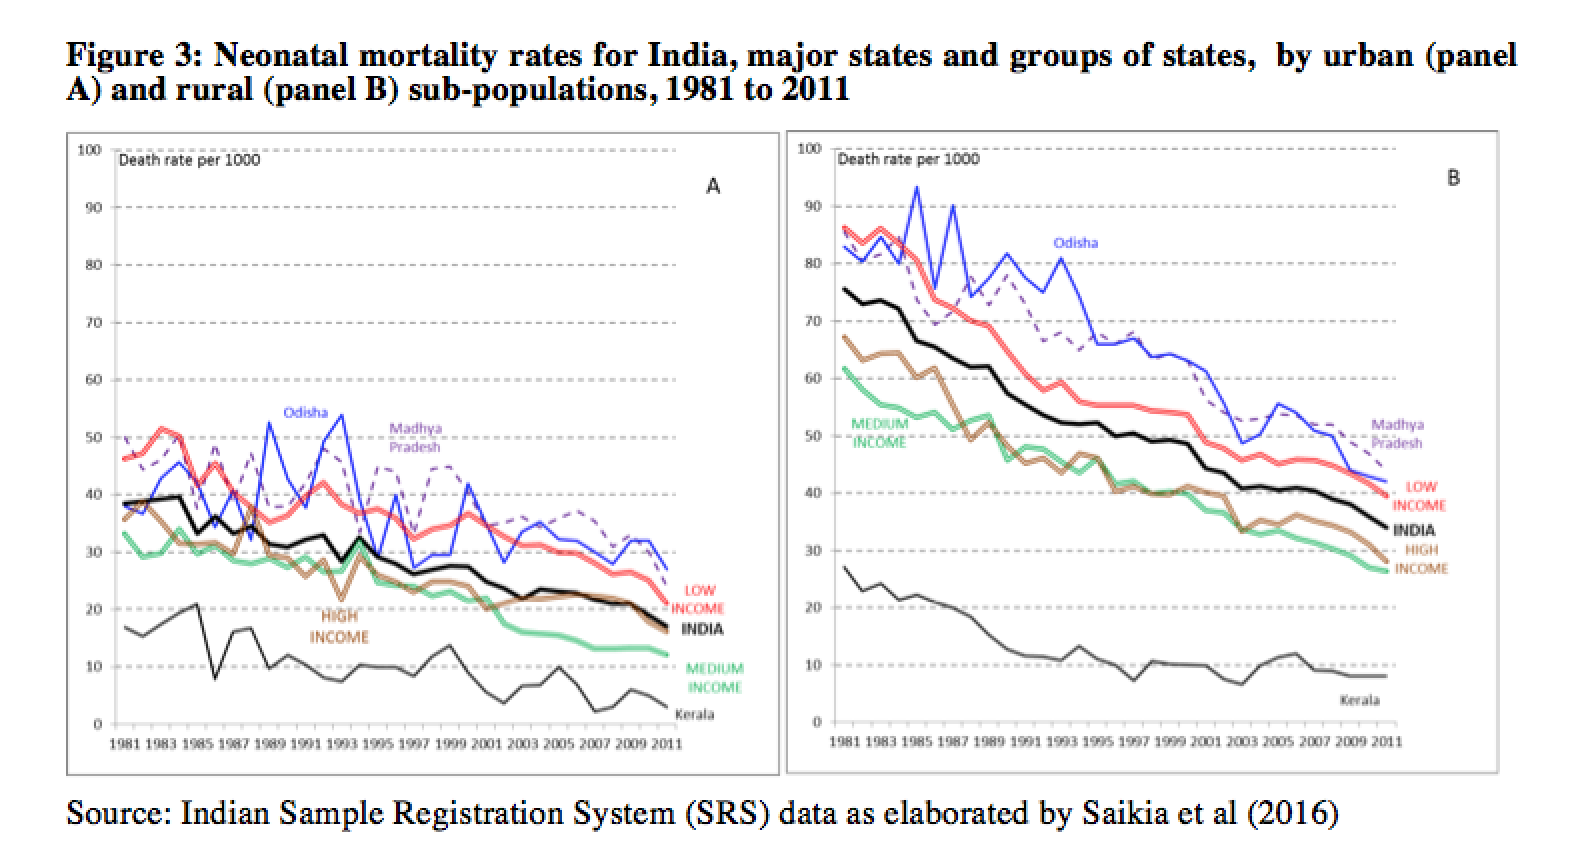
Although the absolute magnitude of the rural excess in NMRs has diminished greatly, the rural NMR remains twice as high as in urban areas (Figure 3). Throughout the period under consideration, the rural NMR was higher than the urban NMR in each state, with the sole exception of Kerala in the 1980s (Figure 3). The variation in NMRs across states was higher for the rural population.
The NMR of the high-income states has been higher than that of middle-income states since the 2000s. This is interesting, since the NMR of high-income states has not yet reached the minimum level of NMR experienced in some other Indian states. The highest absolute decrease in rural NMR occurred in middle-income state Tamil Nadu, followed by the low-income state Uttar Pradesh. Tamil Nadu also experienced the highest relative decrease in rural NMR, followed by the state of Kerala. Literatures suggest that differential levels of social-political development (including women’s autonomy and rights, literacy, etc.) and differential accessibility and functioning of the health care system widen the NMR differences between states.
Did geographical disparities in NMR decrease over time?
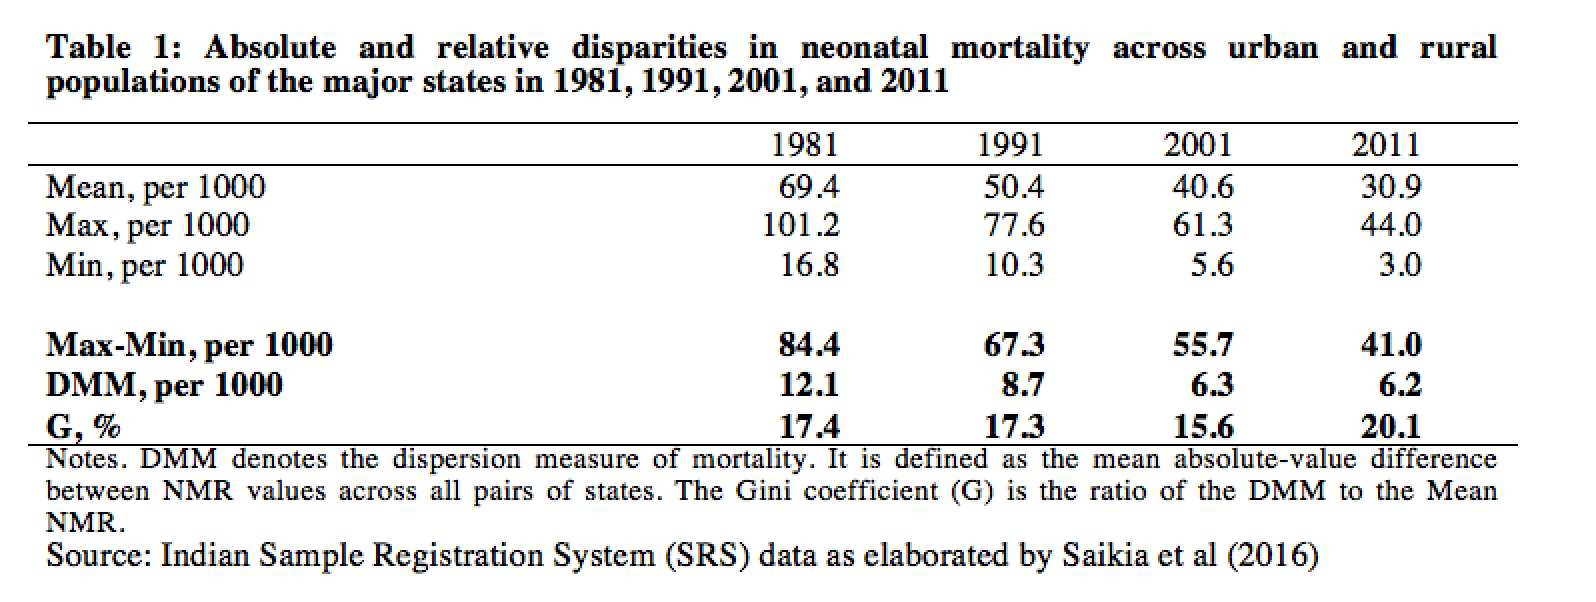
Table 1 presents two types of measures of absolute and relative disparity with respect to NMR across 30 sub-populations (urban and rural populations in 15 states). These are simple range measures (Max-Min), the Lorenz curve-based dispersion measure of mortality (DMM) and the Gini coefficient (G). While the range measures depend on the two extreme NMR values, the DMM and G measures express the absolute and relative inequality across the entire distribution. DMM has decreased over time, but it stabilized between 2001 and 2011; G decreased from 1991 to 2001, but then increased again in 2011 to a level higher than in 1981. In short, absolute geographical disparity in NMRs has shrunk over time, but relative disparity has instead increased in the last decade.
What do we learn from this study?
Despite falling by more than half over the past decades, the national NMR in India in 2011 was still ten times higher than the corresponding figure in urban Kerala or in the majority of developed countries. Temporal NMR decreases have been uneven across sub-populations: both high- and low-income groups of states were unable to maintain the pace of NMR reduction of the 1980s: they experienced episodes of stagnation or even marginal increase, which may reflect internal (i.e., between individuals, within states) economic inequality, which is on the rise. Also worrying is the persistence of the NMR disparity across the regional and urban-rural divide.
In short: in terms of NMR, as well as in a number of other dimensions in India, progress is under way, but much remains to be done.
References
Saikia, N., Shkolnikov, V. M., & Jasilionis, D. (2016) Trends and Sub-National Disparities in Neonatal Mortality in India from 1981 to 2011. Asian Population Studies, 12(1), 88-107.
UNICEF (2016) The state of the World’s children 2016. Accessed on 14th July 2016.
¹ Under-five (or child) mortality refers to deaths in the first five years of life; infant mortality to deaths in the first year of life; neonatal mortality to deaths in the first 28 days of life.


